What is QGIS Cloud
If you work with local geodata in a desktop GIS, sooner or later you will be asked to make the geodata available to a wider circle of users in the form of a web map or to share the data in the database with other users via web services. This requires an infrastructure consisting of servers with running OGC compliant web server software, databases, WMS/WFS/WFS-T/WMTS/WCS servers, and web maps that run in the browser.
One can build an infrastructure that meets exactly the requirements described above. But configuring and maintaining such a system needs some know-how. A lot of time and money is needed to configure and administrate your own server and especially to make it secure against hackers.
QGIS Cloud (www.qgiscloud.com) is the easier way to run such a spatial data infrastructure without having to run and secure your own server with suitably configured services. The idea is to publish QGIS projects 1:1 in the infrastructure. Practically all configuration work on the services are done and managed with QGIS. With the QGIS Cloud plugin you can upload local data to the QGIS Cloud database and publish web maps as well as the OGC compliant services at the push of a button. Thanks to the QGIS Server that is used in the process, the published maps look exactly like they do on the desktop.
QGIS Cloud is a service provided by the company Sourcepole. For testing and non-commercial activities you can use QGIS Cloud Free. For commercial or government applications, they need QGIS Cloud Pro (https://www.qgiscloud.com/de/pages/plans).
What can QGIS Cloud do?
- Web maps:
Create complex maps with QGIS Desktop and use all the style options offered by QGIS Desktop. Publish the data and maps with the QGIS Cloud plugin. All this in just a few minutes.
- Data management:
QGIS Cloud provides a complete PostgreSQL database extended with the PostGIS spatial component. New databases can be created directly from QGIS Cloud plugin with just one click. These databases can be managed with any compatible administration tool, such as pgAdmin or QGIS Database Manager, with full access to all features of a PostgreSQL / PostGIS database.
- OGC Webservices:
Maps and data can be shared via OGC (Open Geospatial Consortium)-compatible web services. Maps can be displayed via WMS or the data can be downloaded via WFS. With WFS-T, the geodata can even be edited directly via the web service.
- Print maps:
QGIS Cloud offers high quality maps via WMS. With QGIS Desktop and all the options it offers, any number of print layouts can be created. Creating maps with any paper size and print resolution up to 1200 dpi is possible.
- Security:
The data is stored in the cloud in PostgreSQL databases. Access to the databases is password protected and encrypted. If the services are to be made available only to a limited group of people access to resources can be restricted with QGIS Cloud Pro. QGIS Cloud Pro. With QGIS Cloud Free all services of the QGIS Cloud freely accessible.
QGIS in a Nutshell
QGIS Cloud is, as the name suggests, very closely related to the leading open source desktop GIS QGIS. To use QGIS Cloud you need to know some basic features and functions of QGIS Desktop. Therefore, we will briefly discuss QGIS Desktop here. More detailed information can be found in the online documentation of QGIS, which can be found at qgis.org.
If you already know QGIS Desktop, then you can simply skip this section.
The QGIS Suite
QGIS is the world’s leading professional open source GIS suite built on free and open source software (FOSS). The QGIS project is an official member of the Open Source Geospatial Foundation (OSGeo). It runs on Linux, Unix, Mac OSX, Windows, and Android, and supports a variety of vector, raster, and database formats and functions.
QGIS Suite consists of the components:
- QGIS Desktop
QGIS is a geographic information system for viewing, editing and capturing spatial data and is GNU General Public License licensed. Key features of the application are the broad support of common vector and raster data such as Shapefile or GeoTIFF, but also spatial databases such as PostGIS and SpatiaLite, sophisticated digitizing tools for capturing vector data and a print compilation for easy creation of map printouts.
- QGIS Server
Publish your QGIS projects and layers as OGC compatible WMS, WFS and WCS services. Control which layers, attributes, layouts and coordinate systems are exported. QGIS Server is considered as a reference implementation for WMS 1.3.
- QGIS Web Client 2 (QWC2)
Publish your QGIS projects easily on the web. Benefit from powerful symbolization, labeling and blending features and impress with your maps.
These three components, united with PostgreSQL/PostGIS databases, result in all the building blocks for a distributed spatial data infrastructure.
In the following sections we will only very briefly explain the steps for a first map. The very detailed and comprehensive documentation of QGIS can be found at qgis.org/en/docs/index.html
QGIS Desktop Install
Standard installations are available for MS Windows and macOS. Binary packages (rpm and deb) or software repositories are provided for many variants of GNU/Linux nix.
For more information and instructions for your operating system, see download.qgis.org.
Download sample data
For our QGIS Desktop to be of any use we need data that we can display and manipulate. If you don’t have any data available at the moment, the best thing to do is to download the following two files and unzip them:
Natural Earth Data: ne_110m_admin_0_countries.zip
Natural Earth Data: ne_110m_rivers_lake_centerlines.zip
QGIS startup and exit
QGIS can be started like any other application on your computer. This means that you can start QGIS by:
double-clicking the QGIS icon or desktop shortcut.
with Linux using the application menu, with Windows using the start menu or with OSX using the dock
Double-click an existing QGIS project file (with .qgz or .qgs extension). Note that this will also open the project.
qgis in the command line, assuming QGIS has been added to your PATH or you are in the installation folder
To stop QGIS, use:
on Linux or Windows the menu options Project -> Exit QGIS or use the keyboard shortcut Ctrl+Q
on OSX QGIS -> Quit QGIS, or use the keyboard shortcut Ctrl+Q
or use the red cross in the upper right corner of the main application window.
Create project and load data into it
By launching QGIS Desktop you automatically create an empty project into which you can now load data.
Quickstart QGIS Cloud
In the following sections, we will use a simple example to show you how to use QGIS Cloud to effortlessly publish your first web map. The following chapters will show in more detail the possibilities QGIS Cloud offers.
For the very impatient among you, we can quickly publish a map on the Internet, step by step. Along the way we will build your personal QGIS Cloud environment.
QGIS Cloud setup
Before you start, first launch QGIS Desktop. And then you start:
The work with QGIS Cloud is organized by the QGIS Cloud plugin. Therefore, you need to install the QGIS Cloud plugin on your computer first. To do this open the Plugins->Manage and Install Plugins … menu. Activate the menu item All and enter in the search field: QGIS Cloud. Then you should see the description to the QGIS Cloud plugin.
To install the plugin in your QGIS Desktop environment, click the Install Plugin button.
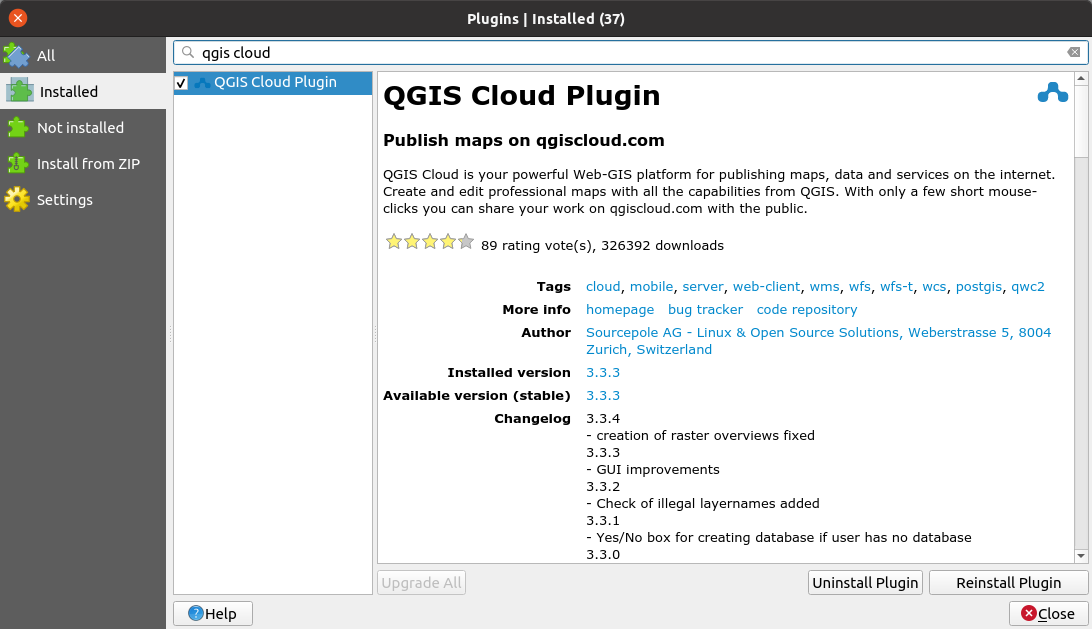
install the QGIS Cloud plugin
After installation, the widget with the QGIS Cloud plugin dialog will appear in the bottom left corner.
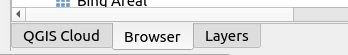
QGIS Cloud widget tab
In order to work with QGIS Cloud you must signup an QGIS Cloud Free account. To do this, click the Signup link in the Account tab. The Sign up for QGIS Cloud – Free site will open. Once you have registered on the site and confirmed the account in the confirmation email, go back into the QGIS Cloud plugin in QGIS and open the Account tab. Log in to the newly created account by clicking the Login button. The login dialog (figure) will open and you can log in with the username and password you just created.
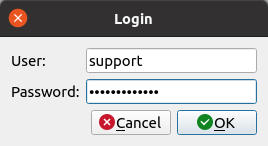
login
Now the connection between the plugin and the QGIS Cloud services is established.
Since the local data will be published to the internet via QGIS Cloud, they need to be available there as well. Within your QGIS Cloud account, the data will be stored in a personal PostgreSQL/PostGIS database on db.qgiscloud.com. The creation of a personal database is done via the QGIS Cloud plugin. Special database knowledge is not required for this. The plugin will do everything for you.
In the Account tab click the Create button and after a short time the newly created database will appear, which in our case has the name cbohgu_wkwjgu (figure). The name of the database cannot be changed and is randomly generated. This database will be used in the future to store all data that will be published using the QGIS Cloud services.
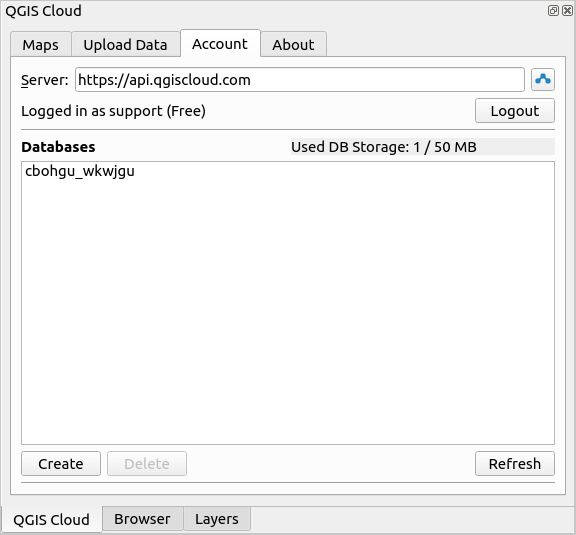
personal database cbohgu_wkwjgu is created
If you don’t like the name of the database, then you can highlight the database in the dialog and simply click on the Delete button to remove it and create a new database. Just as we have done above. Maybe this database will have a “nicer” name. With the QGIS Cloud Free account you can have one single database in use.
Once you have successfully completed these steps and a database entry is visible in the QGIS Cloud plugin, you are done with the basic configuration of QGIS Cloud.
By creating the database, it is also registered in QGIS right away. I.e. when QGIS Browser is opened the database can be accessed directly, just like any other PostgreSQL/PostGIS database. The same is true for the QGIS Database Manager. The database is also registered there and can be edited. We will introduce more ways to access the database in section Access to *QGIS Cloud* Database.
Now we can venture to publish the first map.
Publishing a map with the QGIS Cloud plugin
The QGIS Cloud server that generates the maps on the internet is the QGIS Server. There are many different server services that can be used to generate maps. These are for example MapServer or Geoserver. All these servers have the disadvantage that to publish a map via these systems more or less complicated map definitions have to be created.
With QGIS Cloud this is different. The QGIS Server understands 1/1 the projects you have created with QGIS Desktop on your PC. Therefore, no further map definition is required and the map product will look exactly as you see it on your desktop. It also follows that if you know how to use QGIS Desktop, you can easily put a map on the Internet.
But let’s get started and you will see what this means and how easy it all is.
Example map
First, we need a map (project) in QGIS that we can publish. A QGIS project consists of data that you want to display in a thematic map and a symbolization of the data to give it meaning.
Our sample project is intended to be based on free data. The example data from natural earth are great for this. In section Download sample data we show how to download the data.
Open QGIS and go to layer -> add layer -> add vector layer. Download the two shape files ne_110m_admin_0_countries.shp and ne_110m_rivers_lake_centerlines.shp and color them the countries and rivers. Finally save the project under the name example_project.qgs.
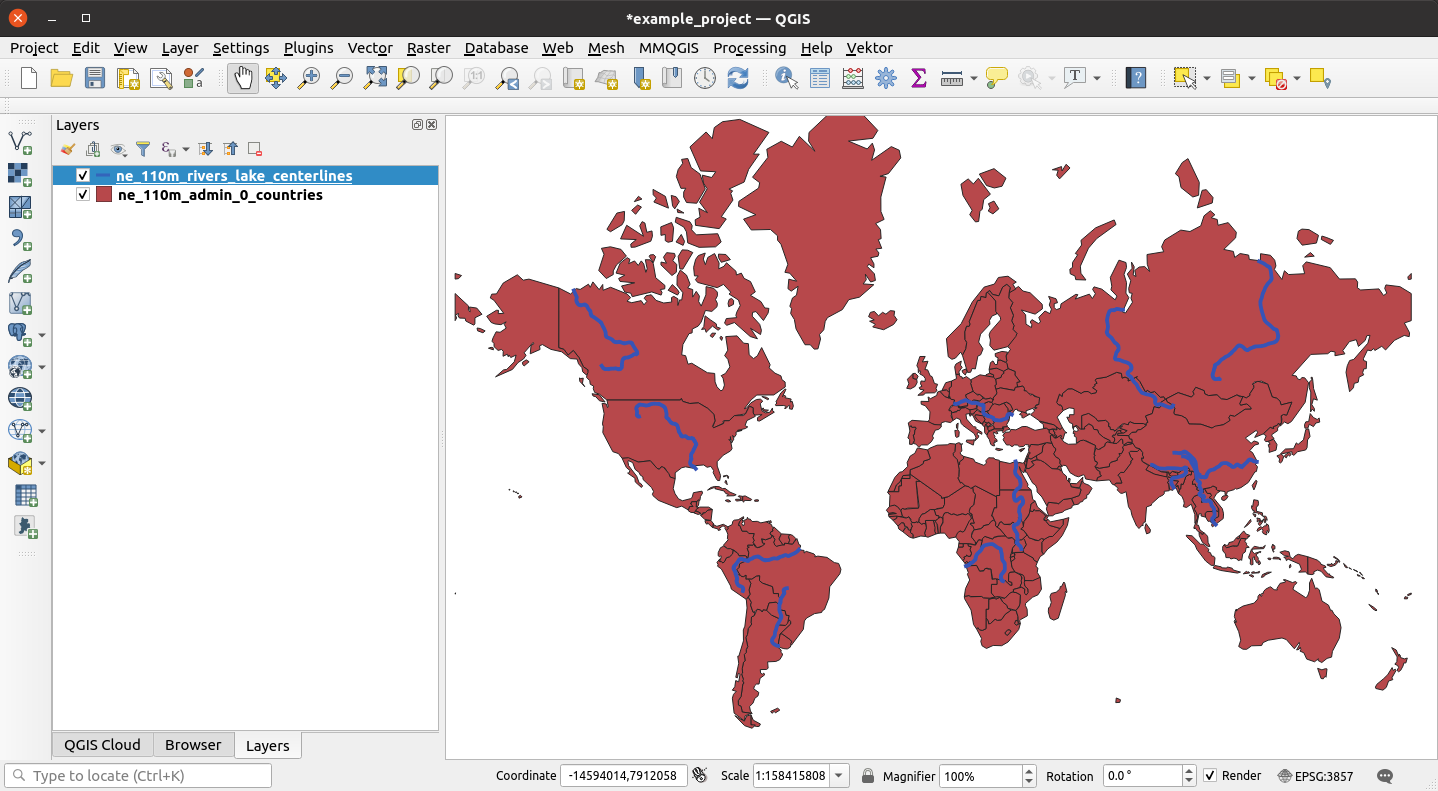
example_project
Now we have a – ok admittedly not very exciting – map of the world in red and the big rivers in blue. This map (project) is now the basis for our map publication on the internet.
Upload data
Our goal is, the map should be viewable on the internet by the whole world. As discussed in section Example Map, a map consists of data and its representation. However, for our example project we still have the data on our PC. For publication on the internet, the QGIS Cloud Server must have access to the data. But how can this be done if the data are stored as shape files on the PC? This is not possible, because the QGIS Cloud server cannot access the data. But we have our nice database cbohgu_wkwjgu, which we created in the QGIS Cloud Setup section. This database is accessible from the QGIS Cloud Server over the internet. That’s great, but our data is still on our PC. How do we get them into the database now?
It’s easy with the QGIS Cloud Plugin. Open the QGIS Cloud Plugin sidebar and log in with your QGIS Cloud username and password. Go to the Load Data tab
In the list there you will see all local layers listed. By default the data is loaded into the database schema public. But you can also select another schema by selecting the desired database schema from the Table schema drop-down list. If you want to create a new database schema, just write the new name into the drop-down list. A new database schema will be created with this name and the data of the layer will be written into it. This is especially helpful if you work with raster data. When you load raster data into the QGIS Cloud DB, then a whole set of additional overview tables will be created. We therefore recommend that each raster layer has a separate database schema.
You can also change the name of the table in the QGIS Cloud DB by entering a new name in the field Table Name of the corresponding layer.
Once you have set everything to your liking, press the Upload data button.
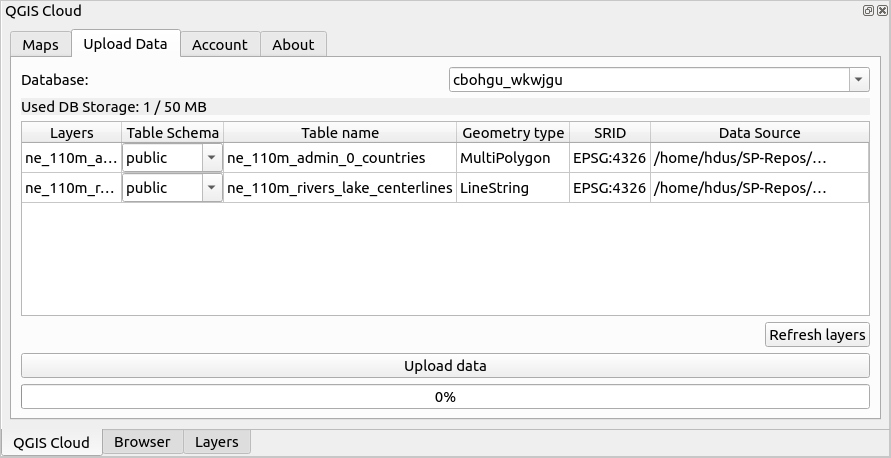
upload local data to QGIS Cloud database
The data is now imported from the local shapefiles into the QGIS Cloud PostgreSQL database. Depending on the size of the datasets, this may take a moment. It is important to know that the data sources in the project are exchanged. You will no longer see the original shape files in the project, but the data from the QGIS Cloud database. If you move the mouse over the layer in the QGIS layer view without clicking, a tooltip appears that shows the data source. And there you can see that the layer’s data comes from our QGIS Cloud database.
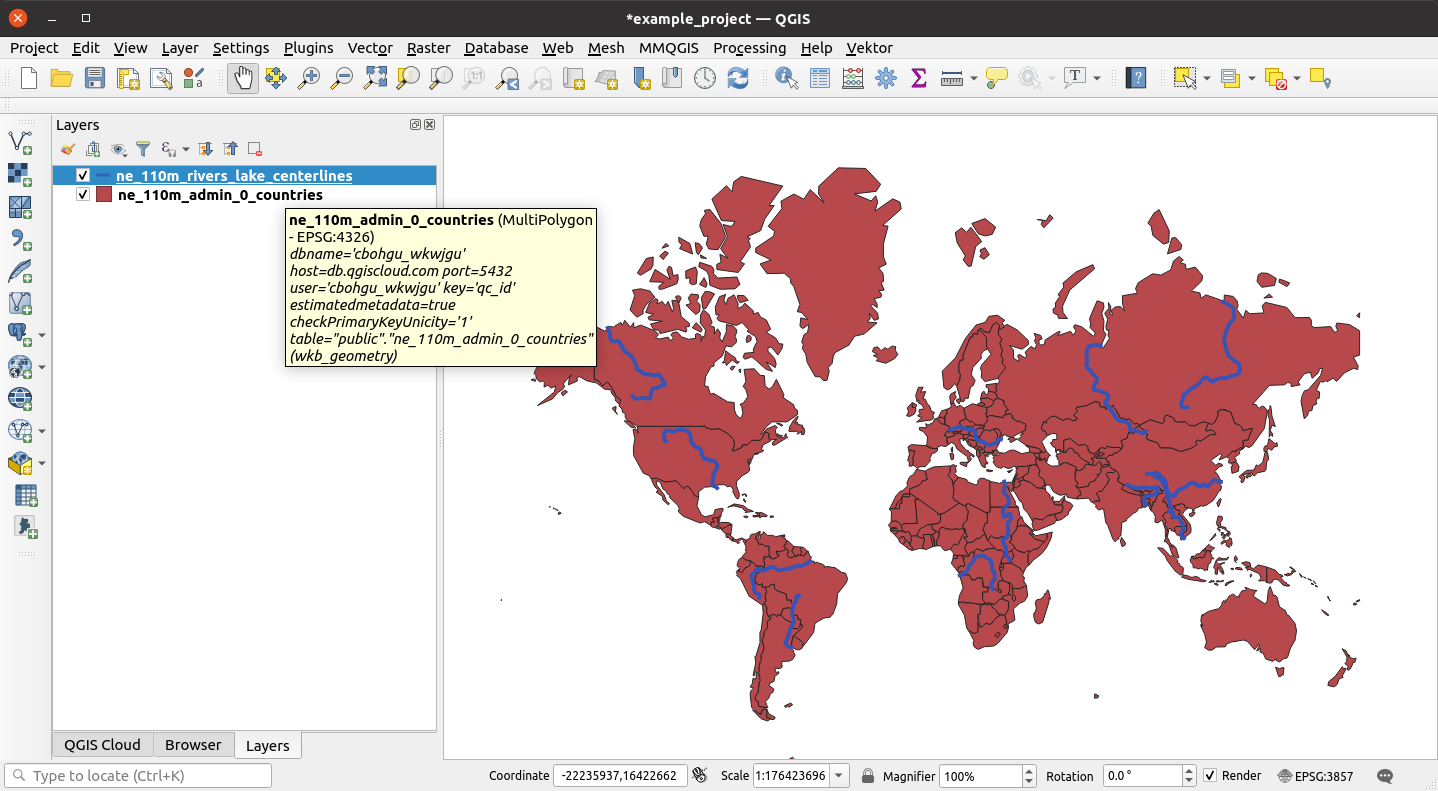
datasources in database
Now the data is in the database and the project is prepared for publishing.
Publish map
Publishing a map means uploading the QGIS project to the QGIS Cloud server and making it available to the QGIS server in this way. The QGIS server loads the project and all layers and display information and sends this display (map) back to the browser as a WMS (see section WMS) in exactly the same display as on the desktop.
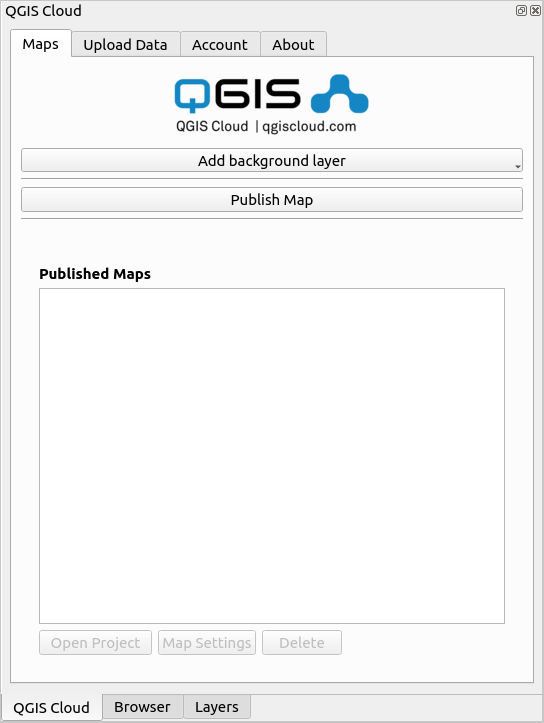
publish map
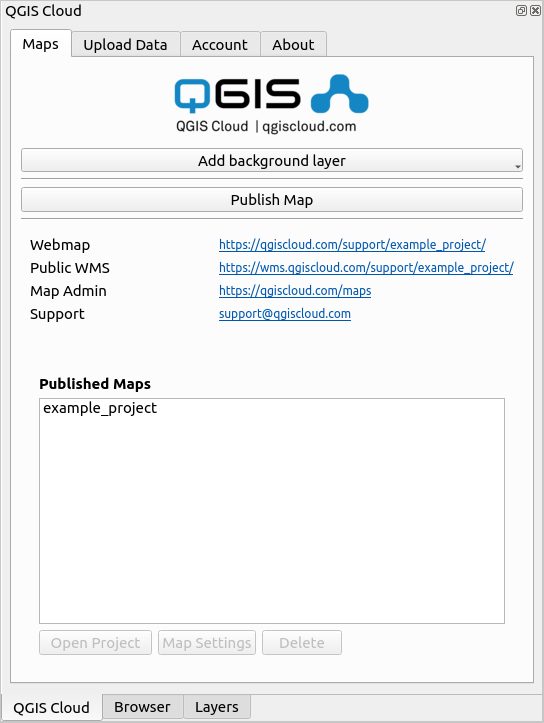
To publish a map, please log in to your account via the plugin at QGIS Cloud. Then open the map tab. If you have not yet published a map under your account, the Published Maps list will be empty. Since all data is stored in the QGIS Cloud database, you can publish simply by pressing the Publish Map button. The rest of the process is now done for you by the QGIS Cloud plugin. If the publishing was successful, the QGIS Cloud plugin dialog should now look like in the figure.
One more note: All maps you publish under a QGIS Cloud Free Account are publicly visible and will be publicly displayed on the site www.qgiscloud.com.
dialog after map publishing is completed
The view of the dialog has now changed. In the previously empty list Published maps our project is now entered. Also, above the list you will now find some links:
- Webmap:
The link leads directly to the published map. If you follow the link the QGIS Cloud webclient will open and display the map (section QWC2)…
- Public OWS URL:
This link describes the base URL to the QGIS Cloud web services. When the map is published, a WMS is always set up for you. But there are other services that can be defined. These are WMTS, WFS, WFS-T and WCS. You can learn how to define and manage these services in section OGC Webservices with QGIS Cloud
- Map Administration:
You have extensive possibilities to further edit the published map. You can do this here in the QGIS Cloud plugin or on www.qgiscloud.com. Later we will explain in more detail what you can do there.
- help:
If you need help or want to reach QGIS Cloud support for any other reason, you can send a mail to QGIS Cloud support directly here.
Now you have got a quick overview of the simple possibilities that QGIS Cloud offers. In the following sections we will go into more depth and show you what else you can do with QGIS Cloud. There is much more in it than you have seen so far. Let us surprise you.
The QGIS Cloud Plugin
In the section Quickstart you already got a first impression of the possibilities of the QGIS Cloud Plugin. In this chapter, we will now go into more detail about the other features of the plugin.
Add background layers
Our example project currently contains only two layers that are displayed in the map. For better spatial orientation, you usually need one or more background maps in addition to the actual thematic layers. These can be aerial photos or completely different topographic maps. Bing and Google Maps can also be used. However, with the latter, the license conditions for publication must be observed.
In QGIS different background maps can be used:
WMS and WMTS layers can be loaded into the map with layer -> add layer -> add WMS/WMTS layer.
xyz layers, such as maps from OpenStreetMap, Bing or Google. These layers can be loaded either in the QGIS Cloud plugin using map -> add background layer or in the QGIS Browser using XYZ Tiles.
We now want to integrate the very nice OpenTopoMap into our project. To do this, open the QGIS Cloud Plugin again and log in to QGIS Cloud. Then open the Maps tab. At the top of the dialog you will find the button Add Background Layer. When you click on it, a menu opens with different map offerings. Select OpenTopoMap -> OSM OpenTopoMap from the list. Then click Publish Map to publish the change to the map. Take a look at the map using the link to Webmap. Now you should see the OpenTopoMap displayed in the background.
To make the web map respond quickly to zoom and pan actions, QGIS Cloud tries to include background maps directly in the web map without going through the QGIS Server. The QGIS Cloud application makes sure that this is only the case in the web map. For direct embedding to be possible, the coordinate reference system of the map must be the same as that of the background map. The QGIS Cloud Plugin will give a warning if this is not the case.
If direct inclusion of background layers is not desired in a project, the property Display external WMS, WMTS and XYZ layers as background maps can be disabled in the Map Settings on the QGIS Cloud website. The link to the web-based map administration will be displayed in the Maps tab for the specific map in the plugin.
Map administration
The QGIS Cloud Plugin can be used to perform a number of map administration tasks. These management tools are all located in the Maps tab. On the one hand, as we have already seen, you can publish the maps there. Then you can see there, in a list, your personal published maps. But you can do more there.
the tab Maps with one published map
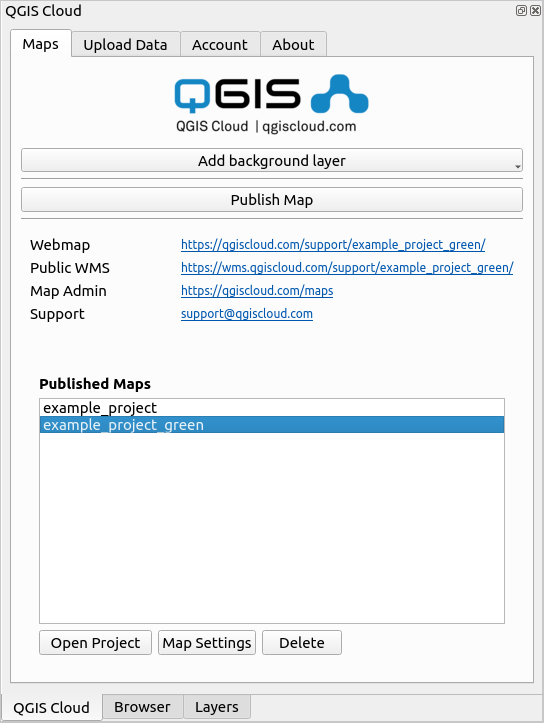
To make it easier to understand how the map administration works, we publish another map on QGIS Cloud. Modify the current project example_project by changing the color of the countries from red to green. Then save the project with the name example_project_green. Once you have saved, publish the project to QGIS Cloud. If you don’t remember how to do this, just look in the section Publish Map.
Now if you click on either map, you will see how URL to Webmap and Public OWS change respectively. Since you have published different maps, different URL must exist as well.
At the bottom of the Maps tab you will find three buttons. The functions of the three buttons always refer to the – in the list – marked map.
- Open project:
By clicking this button you can open, edit and republish the project published on QGIS Cloud directly in QGIS. This is especially useful if you no longer have the original project. Then you can simply get it back from QGIS Cloud to your desktop and continue editing.
- Delete:
This allows you to delete the selected map from QGIS Cloud Server. This will completely remove the project from the server is no longer published.
- Map Installations:
Using the map settings, you can make various settings. The possibilities you have with your QGIS Cloud Free Account we will look at in more detail in a moment. If you change the map settings, then you will need to republish the map not.
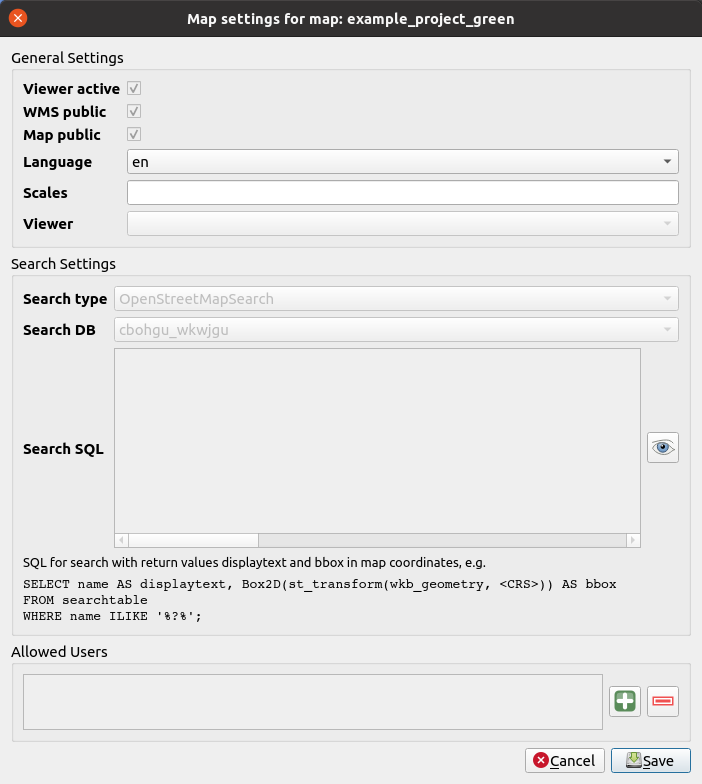
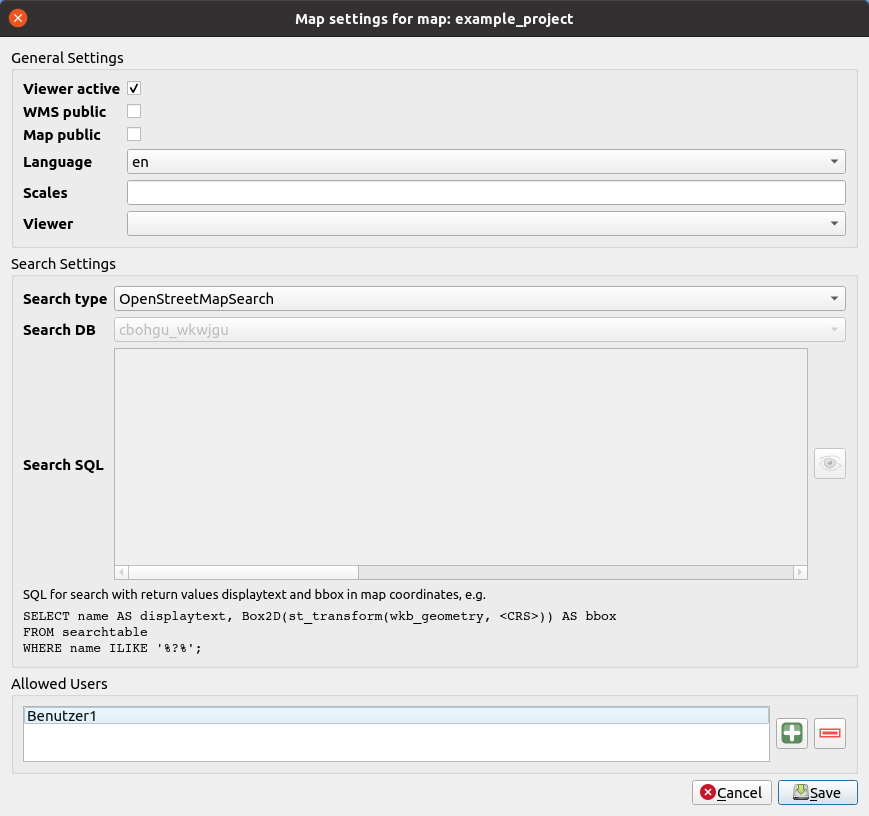
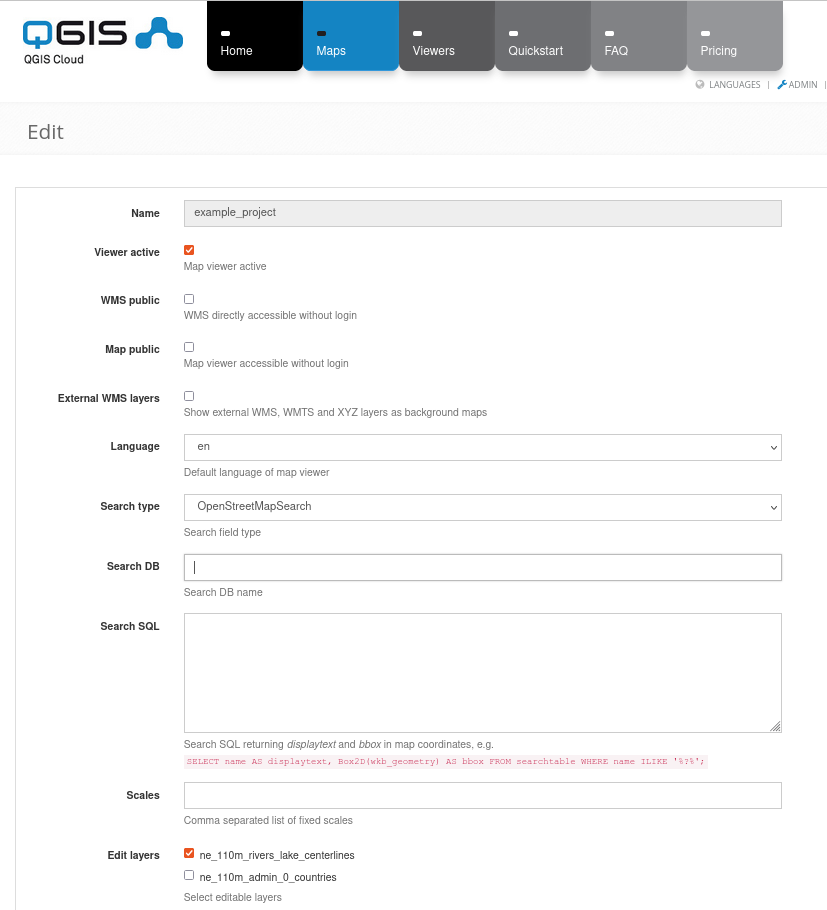
setting options for a map in QGIS Cloud Free
The figure shows an overview of the settings options for a map. In our case there are only two setting options:
language
scales
All other options are only changeable or usable with a QGIS Cloud Pro account. These features are described in detail in the section QGIS Cloud Pro Features section.
Set Language
With a QGIS Cloud Free account it is possible to fix the language of the web client to one of the offered languages or to adapt it to the language of the browser with Auto. If the browser language is not available, English will be used automatically. Try it out. Set the language to Auto and click save. Then, when you click on the URL to the webmap, if you access the map from Germany, for example, you will see the labels of the QGIS Cloud Web Client in German. If you want to avoid this and see a fixed language, select one from the list of suggested languages.
Set Scale
You can set the display behavior of the web map so that the map can only be displayed at certain scales. Simply write the allowed scales as a comma separated list in the text box. Try it out by writing the following values in the text box: 1000,5000,100000 and saving this change. Then open the QGIS Cloud Webclient again using the link in the plugin and look at the scales offered in the footer of the web client.
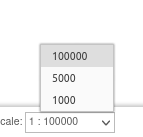
user-defined scales in QGIS Cloud Webclient
As you will notice, the map can now only be displayed at these three scales.
The QGIS Cloud Webclient
Publishing a map on the Internet requires an appropriate interface between the computer and people who want information about a particular section of space on Earth. This can only be done with an appropriate webclient that provides the core GIS functions in the Internet browser. These are:
display of a map
display symbolization in legends
switch on and off individual layers
move the map
move the map based on a search
change the scale in the map
query objects in the map
search objects and information
print the map in printable quality
edit the geodata (QGIS Cloud Pro)
All these features are offered by the QGIS Cloud Webclient with a QGIS Cloud Free account. With the publication of a map, as described in the Quickstart section, these features are automatically available for any map on the web.
Today, web-based offerings like QGIS Cloud need to be able to run on a variety of different devices. This ranges from desktop PCs to tablets to smartphones. This means that the QGIS Cloud web client must be able to recognize the size of the display of the respective device and automatically adapt its appearance to the device. This behavior is called reactive and is supported by the QGIS Cloud Webclient.
The QGIS Cloud Webclient is based on the QGIS Webclient 2 (QWC2) developed by Sourcepole. The QWC2 is constantly being further developed by Sourcepole. These developments are also increasingly being incorporated into the QGIS Cloud Webclient.
The client – an overview
The QGIS Cloud Webclient is deliberately kept very slim. This allows the client to be used intuitively, without any introduction to the application. At the same time, however, it has many features that offer savvy users a comprehensive application.
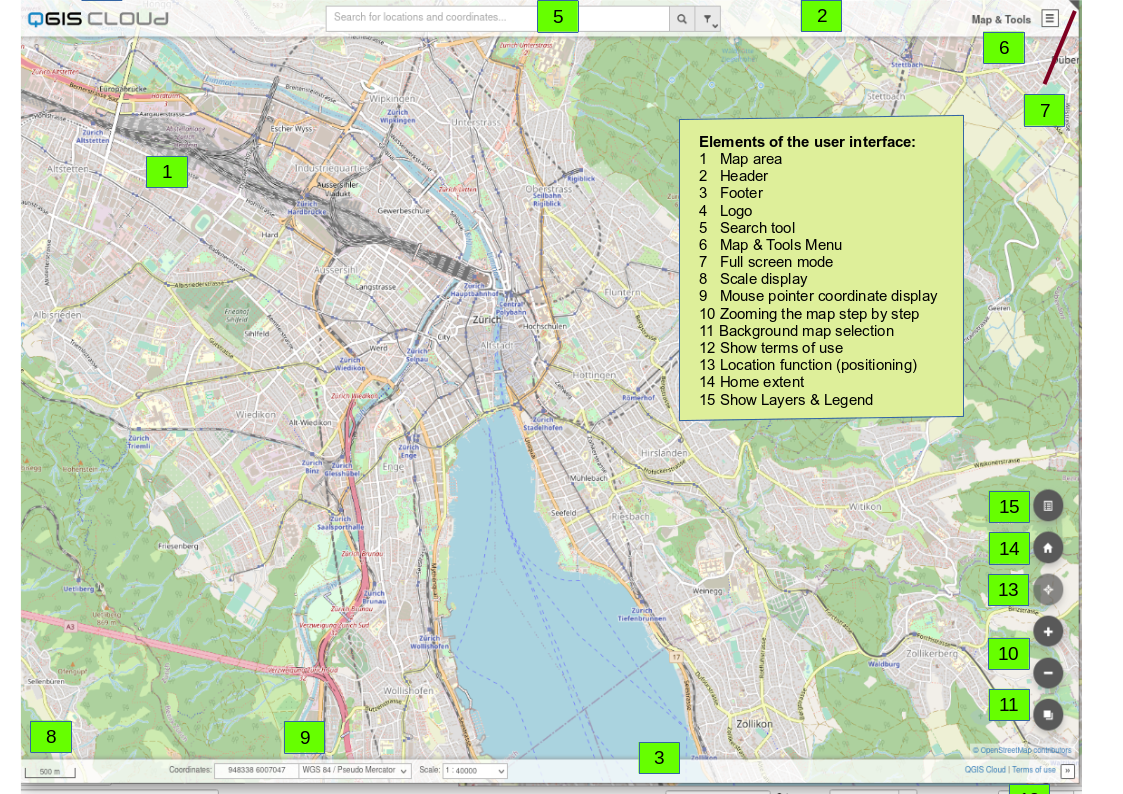
base design of the QGIS Cloud Web Client
Working with QGIS Cloud
Now let’s look more into the special features that QGIS Cloud offers us.
Menu Maps and Tools
Under the menu Maps and Tools you will find the individual map layers and the tools unlocked for your account.
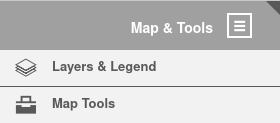
Layers and tools of the QGIS Cloud Web Client.
you can easily turn on/off the map layers with the check mark on the left site.
click on the magnifying glass to adjust the map section to the extent of the layer.
with the slider the transparency of the layer can be changed.
with the arrows the order of the layers in the list and on the map can be changed.
click on the i to display the legend of the layer in large size.
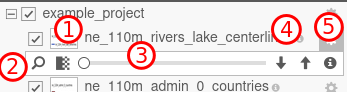
Layer tools of the QGIS Cloud Web Client.
Search Objects
Searching for objects in the map, defined by certain criteria, is one of the most important functions of a GIS application. In the default configuration of the QGIS Cloud web client, search by locations and addresses is integrated, as well as coordinate search. The search by addresses is supplied with information from the OpenStreetMap project, as far as the addresses are recorded. Thus, addresses can be found by simply entering the city, street and house number in the search field. Then a list of successful hits is offered, from which the desired information can be selected by clicking on it.
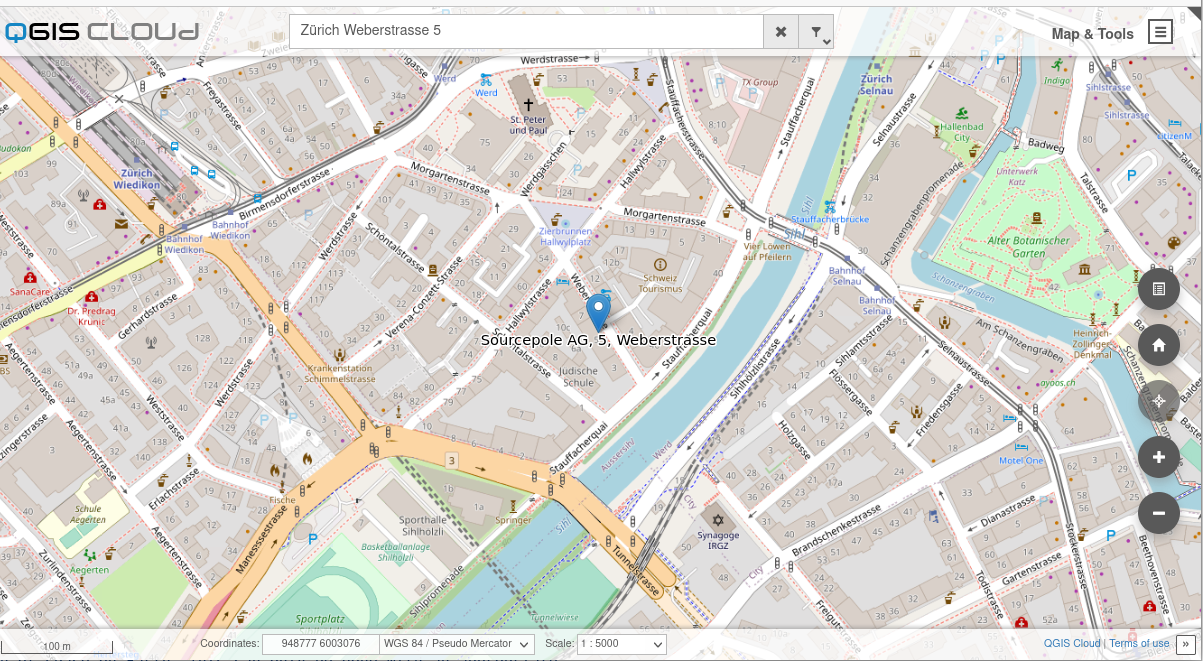
search for addresses
Immediately, the map section of the QGIS Cloud web client jumps to the location of the address and displays it with a blue pin.
The coordinate search is performed in the reference system set in the current view of the QGIS Cloud web client. in the current view of the QGIS Cloud web client. Which reference system is set in the status bar of the QGIS Cloud web client at the bottom of the page. page.
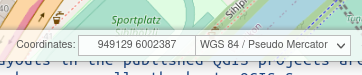
set reference system in statusline
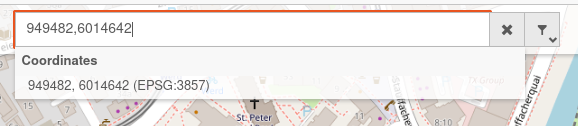
search coordinates
It is also possible to disable the search function in the QGIS Cloud web client altogether. To do this, set the search type to none in the QGIS Cloud Plugin map settings.
Printing with QGIS Cloud
With QGIS Cloud, it is very easy to provide printing functionality in the published maps. The print layouts in the published QGIS projects are automatically available in the web map as well, thanks to QGIS Server. As an example, we add a print layout in the project from chapter Example Map. To do this, we go to project -> new print layout in QGIS and enter the name of the print composition (here ’A4 landscape’). A layout window opens and we can design the print layout by dragging elements (e.g. map, scale, legend, text fields). More information about the numerous layout options can be found in the QGIS user manual.
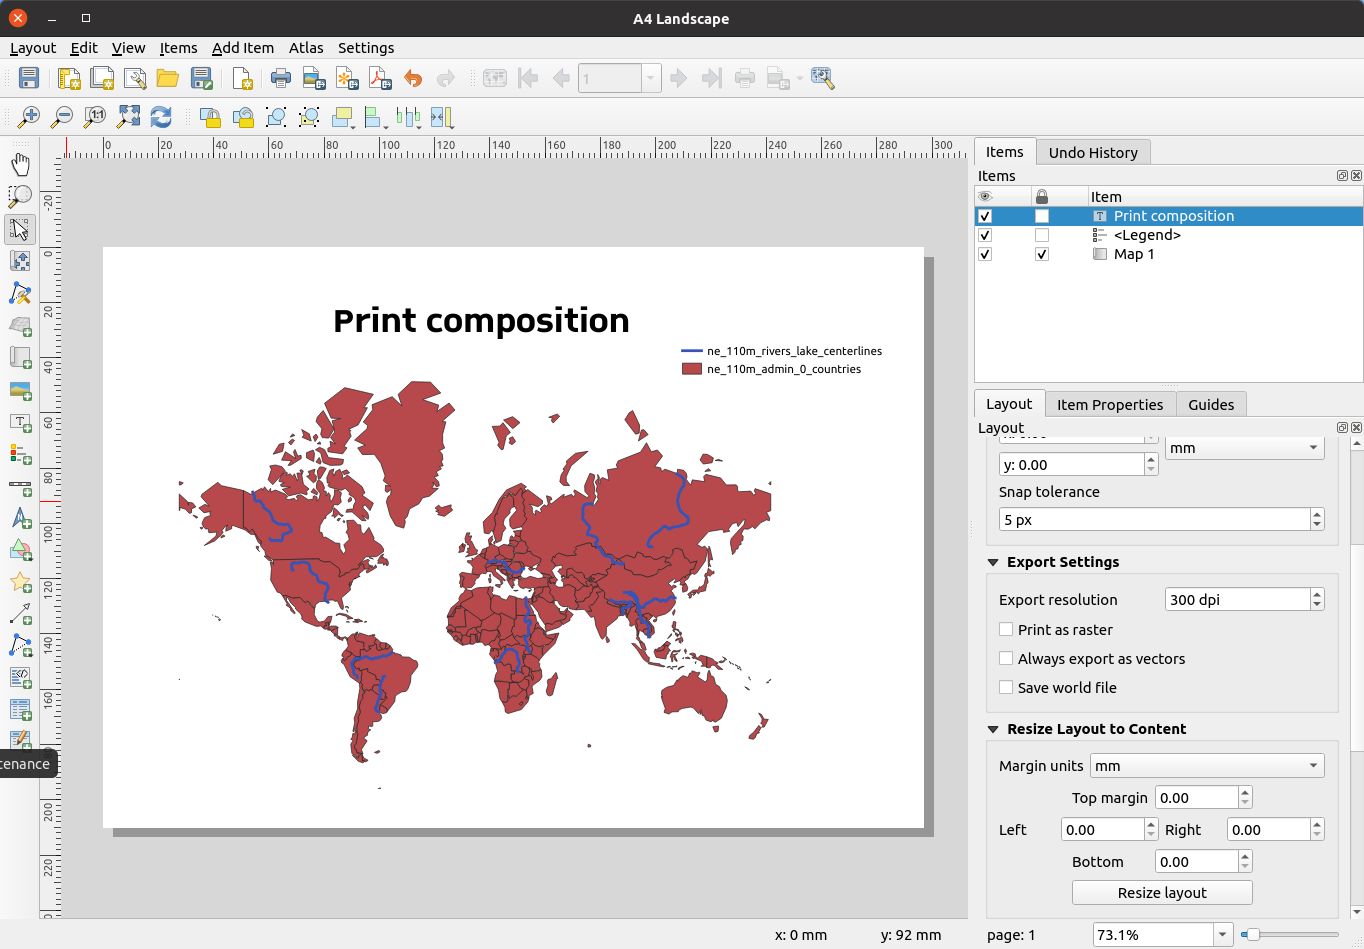
print layout
After saving and publishing the QGIS project, the print functionality can be used in the web map at map and tools->print.
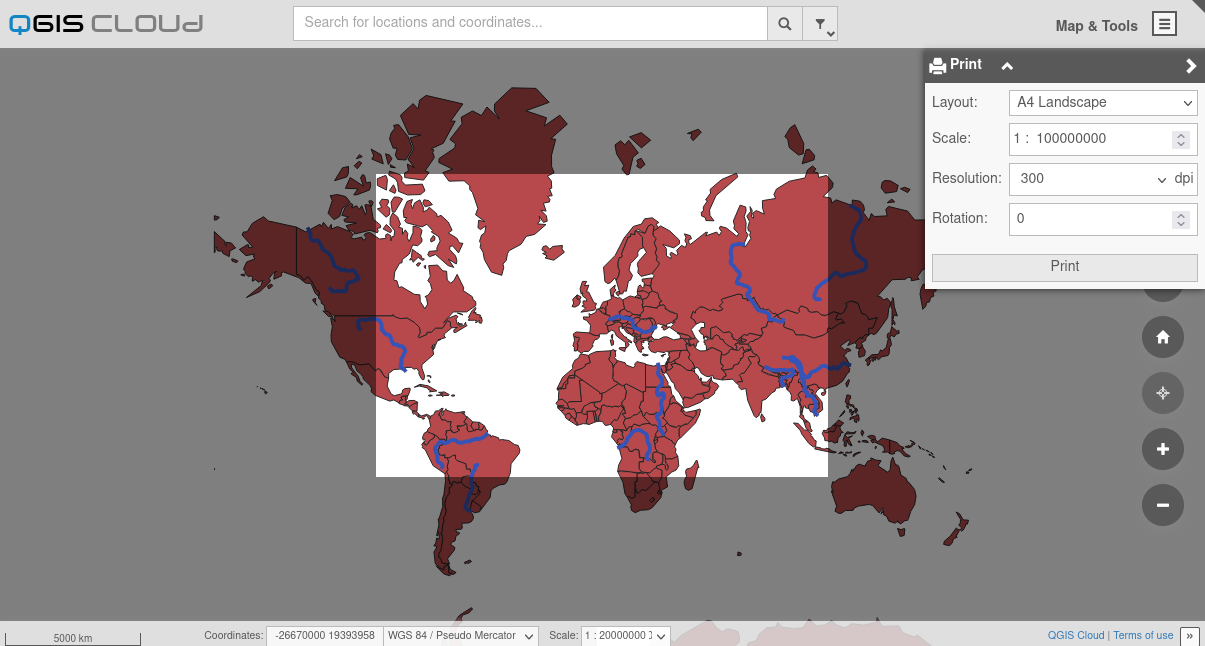
print in QGIS Cloud Webclient
If there are print templates that are for internal use only and should not be published in the web map, these templates can be entered in project -> properties -> QGIS Server -> exclude layouts.
Featureinfo and Tooltips
When clicking on the map in the published web maps, information about the objects is displayed at the mouse position. Additionally, a tooltip can also be configured to be displayed when hovering the mouse over the map. In this chapter we show the most important setting options for these two tools.
Suppress feature info for layer
By default the display of information for all layers is switched on. Sometimes, however, a layer should only be visible without being able to query information about it. For example, if the layer should only be visible as a background map or if the attributes of the layer should not be passed to the outside. Under Project -> Properties -> Data Sources -> Queryable the info tool can be disabled for individual layers if required.
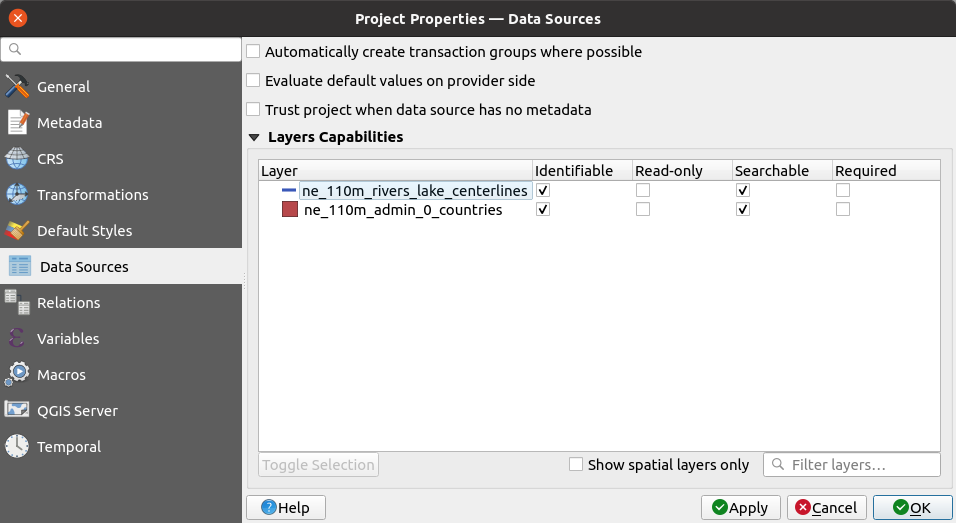
define queryable layers
Sometimes you want to display information for a layer, but some attributes contain confidential information and should not be published. To prevent attributes from appearing in the info tool or web map tooltip, they can be disabled in the layer properties under fields -> WMS.
defining WMS/WFS visible attributes
Modify field in featureinfo popup
By default, when clicking on the map with the featureinfo tool, the ID of the object is displayed for each layer that is queryable. This is certainly rarely the optimal solution. To change this and set it to a field of choice do the following.
Open the “Display” tab in the layer properties and set which field should be displayed in the dropdown menu. That’s all.
Change order of attributes in feature info popup
The order of attributes in the feature info popup specified by the layer is not always optimal. Furthermore, not all attributes should always be displayed. You can change this via the QGIS project to be published.
To change the query result, proceed as follows:
in the layer properties, change the attribute form to Drag and Drop Designer.
remove all attributes you do not want to see from the form.
change the order of the attributes in the Form Layout by dragging them.
activate the option Use attribute form settings for GetFeatureInfo response in the QGIS Server section of the project properties
After republishing the project, the attribute form should match your expectations.
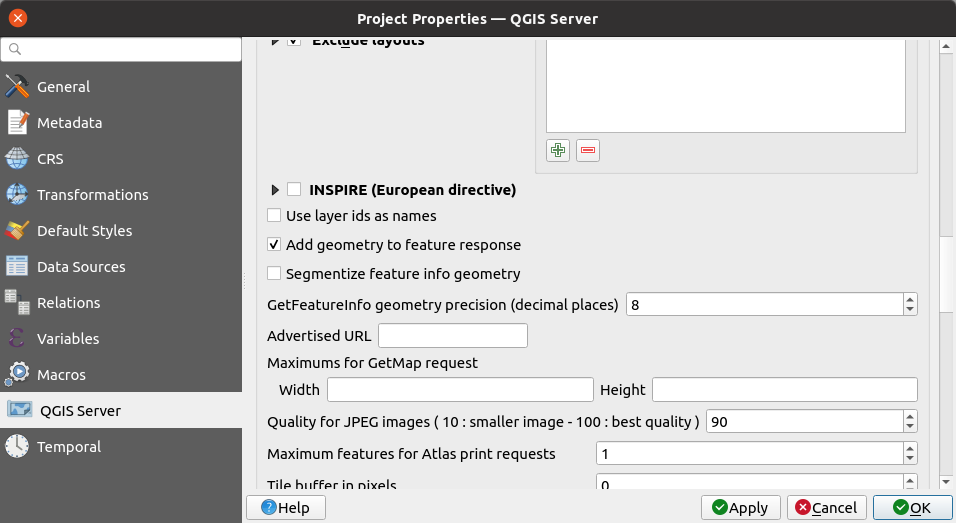
Highlight object on feature info
In a WMS, the map is displayed as an image without the web client seeing the coordinates of the geometries. If publishing the geometry coordinates is not a problem, the option Project Properties -> QGIS Server -> Add geometry to object response can be checked. The server’s GetFeatureInfo response will then include the object’s vector geometry.
feature info with rubberband
This allows the web map to highlight the clicked object.
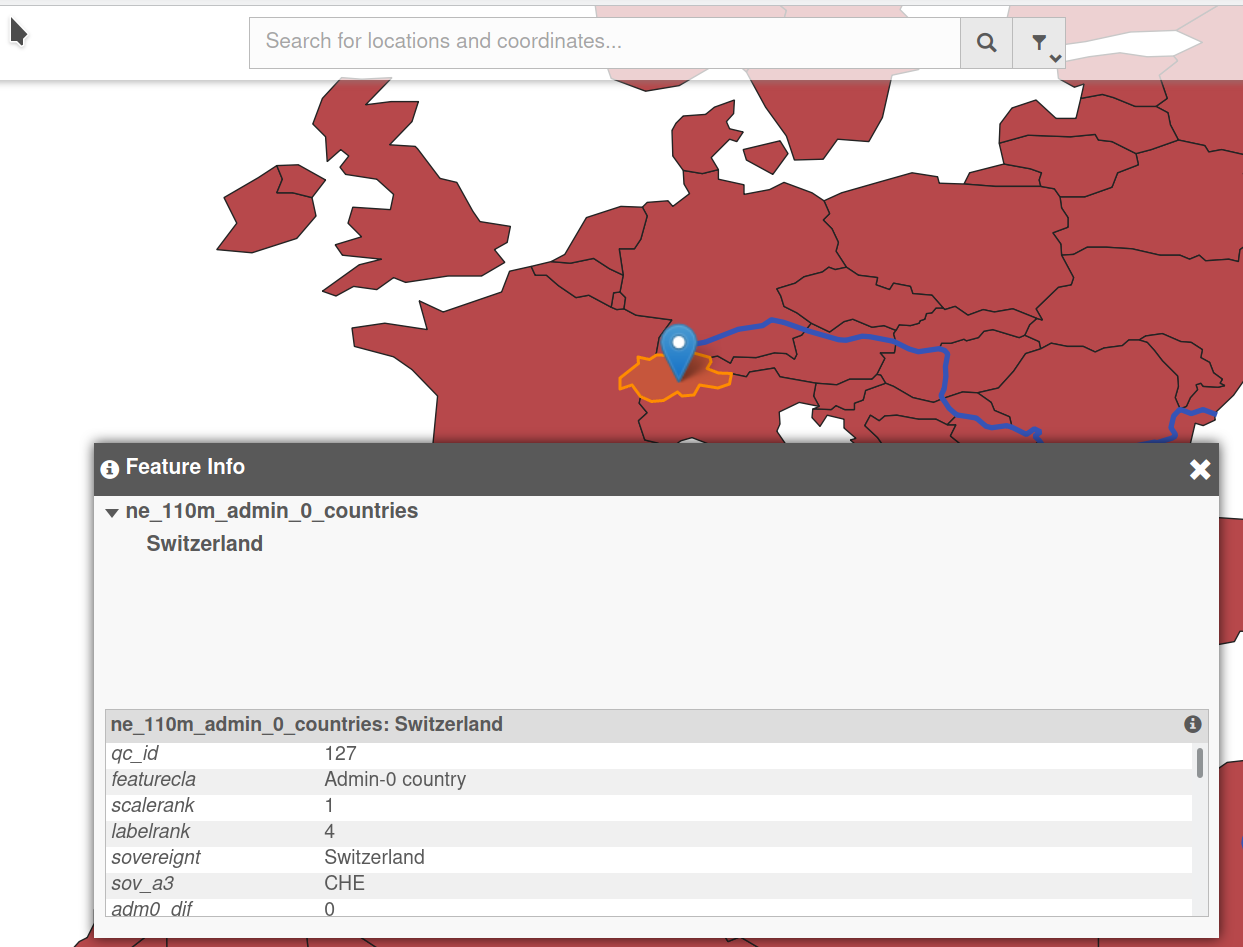
feature info with rubberband
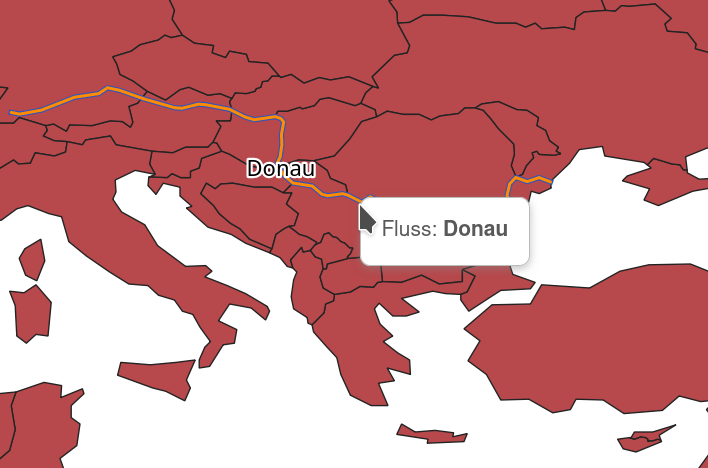
Tooltip feature
In the web map, in addition to the info feature, there is also the tooltip feature. This displays an info text when the mouse hovers over objects. To activate the tooltip function, you can enter the text to be displayed in QGIS in the layer properties under Display -> HTML map hint. Since the text usually depends on the object, QGIS expressions can be embedded in the html between ’[%’ and ’%]’. Attributes and numerous dynamic functions can be used in these expressions. For example, to create the tooltip in the figure below, the text Fluss: <b>[% “name_en” %]</b> was used, where name_en is the attribute name.
You can also organize the text in a table. The HTML source code will then look like this:
<table>
    <tr>
      <td>Fluss:</td><td><b>[% “name_en” %]</b></td>
    </tr>
</table>
HTML tooltip
Access to QGIS Cloud database
The QGIS Cloud database is a normal PostgreSQL / PostGIS database. However, there are restrictions in the access permissions. There is only one user for each database. The name of the user corresponds exactly to the name of the database. This user may use the database, but has no administrator rights. No further actions like including an extension can be performed. The user of the database can execute all actions, which take place on the level of the database. These are e.g. the creation of tables, views, triggers or rules.
After creating a database via the QGIS Cloud Plugin, the connection parameters are automatically entered into the QGIS connections. Thus the database is known and registered for QGIS. It can be managed directly with the QGIS Browser or the QGIS DB Manager. This way you can already do quite a lot with the DB.
But if you want to access the database with a third party product, you need to know the connection parameters (credentials). How to get them we will look at now.
Determining the credentials
The connection to a PostgreSQL database is made through the so-called connection string, which contains the credentials. This must contain the following parameters:
hostname
username
dbname
password
port
For the QGIS Cloud database, several values are already specified:
hostname: db.qgiscloud.com
username: database name
dbname: name of database
password
port: 5432
To connect to the database we are now missing the password. To get the password open the QGIS Cloud Plugin and select the Account tab. There you will also see the list of your databases. Hover over the desired database and you will see a tooltip listing all the credentials. At the end of the tooltip you will also see the password of the database.
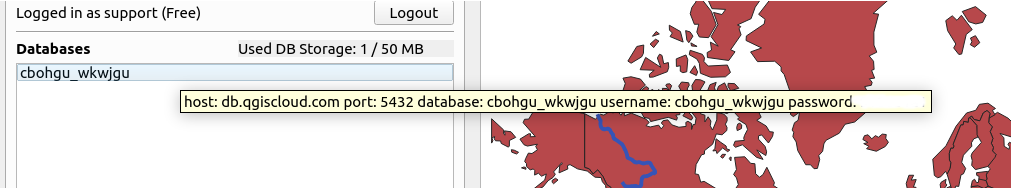
You can use this information to access the database from third-party products.
OGC Webservices with QGIS Cloud
The Open Geospatial Consortium (OGC) is a non-profit organization founded in 1994 as the Open GIS Consortium with the goal of defining the development of spatial information processing (especially geospatial data) based on universally applicable standards for the purpose of interoperability. In doing so, the OGC is built up of members from government organizations, private industry and universities, whose membership in the OGC is subject to a fee. For its part, the OGC has been a member of the World Wide Web Consortium (W3C) since January 2007.[2] The registered trademark is OpenGIS.
QGIS Cloud supports the OGC’s Open Web Services and is thus a complete OGC-compliant spatial data infrastructure. The QGIS Cloud underlying QGIS Server is an OGC compliant map server that supports OGC web services. The configuration of the QGIS Server can be set in the QGIS Project using QGIS Desktop. To do this, open the project properties with the menu Project -> Properties -> QGIS Server. If you check Service Properties you can fill in the basic properties of the service.
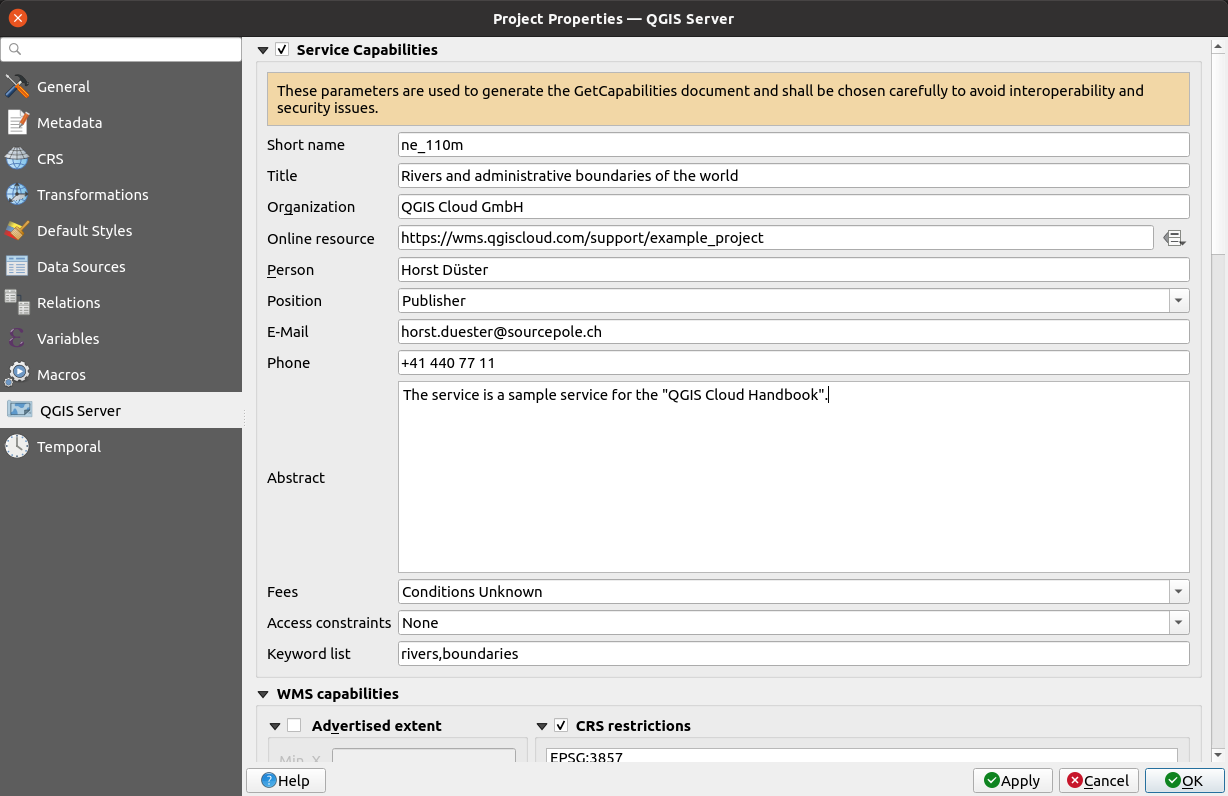
properties of the example service
Once you have filled in all the fields you need to save and republish the project. Publishing also gives you the URL to the service, which is displayed next to “Public OWS URL” in the QGIS Cloud Plugin. Right click on the link to save the URL to the clipboard. In our example this is:
https://wms.qgiscloud.com/support/example_project/
Now type this URL, or the URL corresponding to your account and project, into the address bar of your internet browser or simply click on the link in the QGIS Cloud Plugin. If you submit the URL, then you will get back a ServiceExceptionReport:
<ServiceExceptionReport version="1.3.0">
<ServiceException code="Service configuration error">
Service unknown or unsupported
</ServiceException>
</ServiceExceptionReport>
This is not a reason to panic, but shows that all is well. The server is working and we are getting a response from it. The reason for the error message is that we sent the request to the server without the correct parameters. The message says that we have not told the server what kind of service we want to request. QGIS Cloud serves different services through the service URL. But we’ll look at that in more detail in the next sections.
Web Map Service (WMS)
The OpenGIS Web Map Service Interface Standard (WMS) provides a simple HTTP interface for requesting georeferenced map images from one or more distributed geodatabases. A WMS request defines the geographic layer(s) and area of interest to be processed. The response to the request is one or more georeferenced map images (returned as JPEG, PNG, etc.) that can be displayed in a browser application. The interface also supports the ability to specify whether or not the returned images should be transparent, so that layers from multiple servers can be combined.
With the publication of a map on QGIS Cloud, this map is always automatically also available as WMS and can be used immediately. Let’s try that right now:
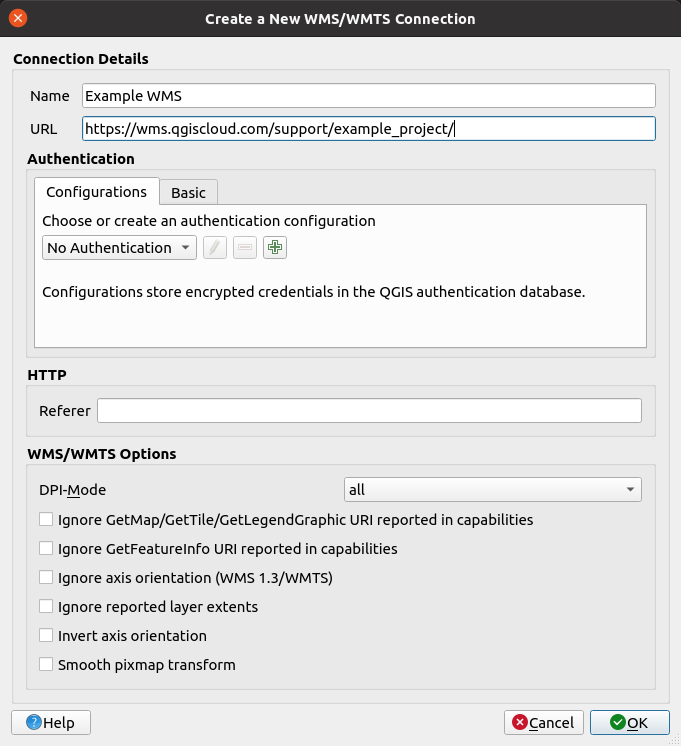
creating a new WMS connection
right click on the OWS URL in the map tab of the QGIS Cloud Plugin.
open the QGIS Browser and right click on the WMS/WMTS entry and select New Connection ….
give the connection a name.
copy the URL from the clipboard to the URL field.
now press OK.
Now the WMS is available as a layer in all future QGIS projects. It couldn’t be simpler, could it?
In the project properties you can configure your WMS even further. In the WMS Capabilities section you can define the dimensions of the WMS map, limit the number of reference systems, print layouts (see section Print with QGIS Cloud) and exclude layers.
The default settings of QGIS projects you want to publish via QGIS Cloud are not the best in terms of QGIS web client / WMS performance. This point becomes noticeable if the published project contains many layers. Then the default settings lead to poor performance because all reference system definitions are downloaded for each layer of the WMS. With many layers and the thousands of reference systems that QGIS Server supports, this adds up quite a bit. Therefore it is important to define which reference systems the published WMS should support. This can be achieved by activating the block KBS-Restrictions and selecting only the reference systems that should really be used.
Web Map Tile Servcie (WMTS)
The standard Web Map Tile Service (WMTS) is a geoservice specified by the Open Geospatial Consortium (OGC). The WMTS defines a web service to provide and retrieve digital maps in a tile-based manner. The goal of the WMTS standard is to provide maps for applications in a performant way. For this purpose, the map is pre-generated on the server side and divided into individual smaller maps, also called tiles, and stored (tile cache). These tiles can then be retrieved individually by the application.
With QGIS Cloud you can also deliver WMTS. By default, QGIS Cloud has WMTS delivery disabled. To enable WMTS go back to Project Properties -> QGIS Server -> WMTS Properties. There you can now define which layer you want to publish.
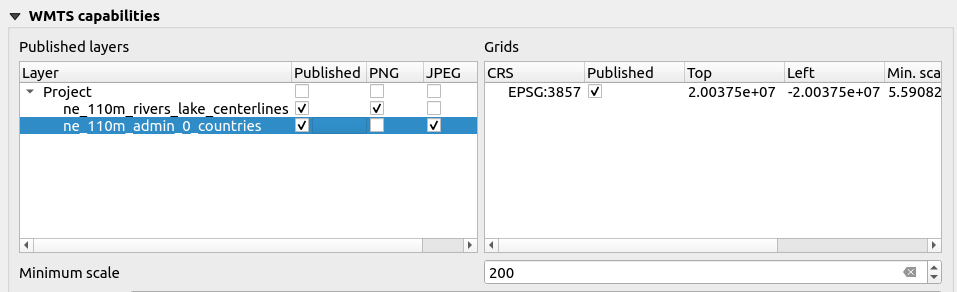
set WMTS properties
In the figure you can see that the layer with the rivers is published and should be delivered in PNG image format. The administrative boundaries, on the other hand, are to be delivered in JPEG image format. Both layers are delivered as single layers and not as a whole map, therefore the project as a whole is not published.
Important: In the WMS properties ’CRS Restrictions’ must be checked. In ’WMTS Properties’ at least one CRS must be selected.
The URL of WMS and WMTS are identical and is always https://wms.qgiscloud.com/<username>/<card name>. The integration of a QGIS Cloud WMTS is done in the same way as for a WMS layer. In order for QGIS to request the desired service - WMS or WMTS - the following extension must be made to the service URL:
https://wms.qgiscloud.com/<username>/<mapname>?Service=WMTS&Request=GetCapabilities.
If this is not done, QGIS will always request a WMS from QGIS Cloud.
WFS
A not so obvious feature of QGIS Cloud is the ability to share your data via the Web Feature Service (WFS) and manage it via the Web Feature Service Transactional (WFS-T). “Web Feature Service (WFS) refers to Internet-based access to geospatial data within a distributed GIS. The WFS is limited to vector data only, such as may be stored in databases.”
You can set up a QGIS Cloud WFS in a few steps if vector layers are loaded in the project. First, define the vector layers you want to publish and make the appropriate settings as follows:
open the project properties -> OWS server tab.
scroll to the WFS Properties section and make the appropriate settings. There, check Published for each layer you want to publish.
Additionally, you can set the published fields of each layer in the Layer Properties -> Fields tab.
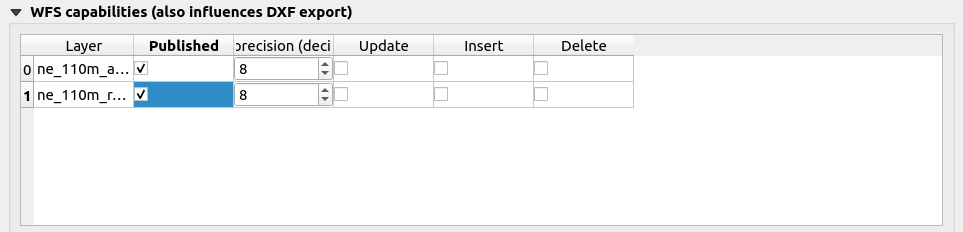
setWFS properties
After publishing the project, the WFS is already available to you. Try it out by using the QGIS Cloud OWS URL to create a WFS-connection to this service, as described above.
WFS-T
WFS-T gives you full access to your vector data for editing via the web. Here, the -T stands for transactional. This means that you can edit vector data using the WFS-T standard. Since QGIS Cloud supports WFS-T functionality, you can manage and edit your data provided by QGIS Cloud from any WFS-T supporting client. QGIS Desktop is a WFS-T client.
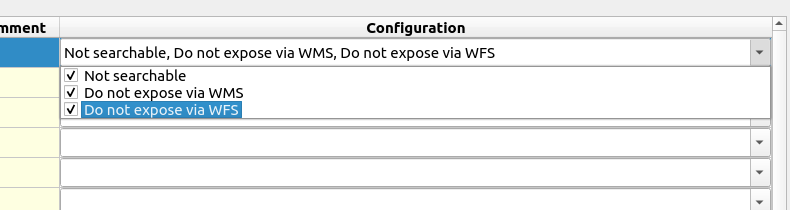
In order for a vector layer to be edited as a WFS-T layer via QGIS Cloud the layer must be prepared. Each layer that is uploaded with the QGIS Cloud Plugin into a QGIS Cloud database gets the field qc_id added during the upload process. This field is filled with a database sequence filled in. This means that for each newly captured object in the layer the field qc_id is filled with a unique numerical value. Since you usually do not know which numbers are already used in the table, the field qc_admin must not appear in the processing. So the display of the field qc_id must be prevented. You can set this in the Properties of the layer -> Attribute form. Under Fields select the field qc_id and change the control type to Hidden.
You also need to prevent the qc_id field from being published via WFS. The by selecting Do not disclose via WFS in Layer Properties -> Fields in the configuration of the field qc_id select do not expose via WFS.
Now you need to republish the project. The field qc_id does not appear in the input form anymore and the new ID can be assigned automatically.
You will need to enable the WFS-T capability again in the already familiar Project Properties -> OWS Server tab. To enable WFS, we have already published the two layers ne_110m_rivers_lake_centerlines and ne_110m_admin_0_countries as WFS. Now enable the Update, Insert and Delete options in the WFS–Properties. After publishing, the two layers will also be available for you to edit. Since the connection to our WFS in QGIS Desktop is already established, we don’t need to do anything more there. Now try out the WFS-T functionality by loading the layer ne_110m_rivers_lake_centerlines over the WFS in QGIS Desktop and switch it to edit mode. You can now edit this layer like any other vector layer in QGIS Desktop.
But note that all services published under QGIS Cloud Free are public and available to everyone. So the whole world can edit your geodata. If you need restricted access, you can do it via a QGIS Cloud Pro subscription (see section Access Protection of Maps).
WCS
“The Open Geospatial Consortium Web Coverage Service interface standard (WCS) defines web-based retrieval of digital geospatial information representing spatially and/or temporally varying phenomena.
WCS grants access to coverage data in forms that are usable for client-side processing, such as scientific modeling. WCS is related to OGC Web Feature Service (WFS) and Web Map Service (WMS). As a service instance of the WMS and WFS, a WCS allows clients to select portions of a server’s information assets based on spatial constraints and other query criteria.
Unlike the Web Map Service (WMS), which provides geospatial data as map images, the WCS provides available data along with their detailed descriptions (metadata) and defines a rich syntax for queries on these data and metadata. In particular, data is delivered back with its full semantics; therefore, unlike the human-only images of the WMS, WCS data can be further analyzed by machines.
Unlike the Web Feature Service (WFS), which returns single spatial data elements, WCS returns multidimensional data that puts a slice of space-time properties into arbitrary relationships. As such, WCS focuses on coverages as a specialized class of features (namely sets of features) and provides functionality accordingly.
WCS is based on the coverage model of the OGC GML Application Schema for Coverages[1] and supports all coverage types from it. In particular, the current version 2.0 is no longer restricted to regular grids like earlier WCS versions. “
Like the previously described services, the WCS is also made in the QGIS Desktop project settings. Just as described in the WFS section, the settings are made here as well.
QGIS Cloud Pro Features
As part of a QGIS Cloud Pro subscription, you have access to additional features that are only available there. The scope of these features is constantly being expanded and made available to QGIS Cloud Pro users. In the following sections we would like to introduce you to these functions in detail.
Customizing the QGIS Cloud Web Client
The QGIS Cloud Web Client is customized via so-called viewers. These viewers are named configurations that can later be assigned to a map view. Any number of such viewers can be created as part of a QGIS Cloud Pro subscription.
These properties can be changed in the QGIS Cloud Web Client by defining a viewer:
Name of the viewer
Header
Set a favicon
Set logo for the desktop client
Set logo for the mobile client
The logo can be provided with a further link
Adjustments to the appearance of the QGIS Cloud Web Client with CSS logic
We will now go through the individual points in turn. Of course we must first create a new viewer, as we don’t have one yet.
Creating a viewer
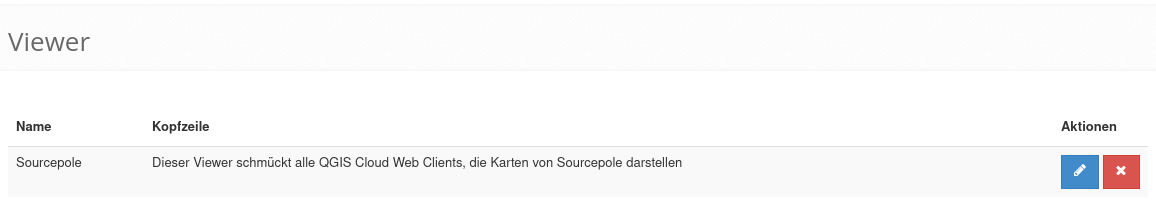
We get an overview of the viewers assigned to the account when we switch to the Viewers area on qgicloud.com (https://qgiscloud.com/viewers). But beware, we only see the menu item Viewers if we are logged in with a QGIS Cloud Pro account.
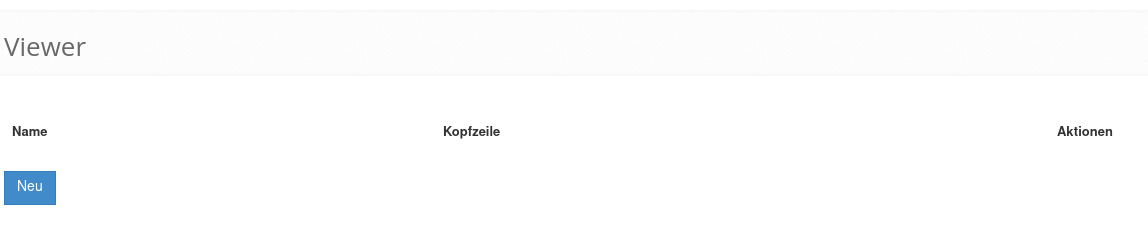
No viewers have been defined yet
The overview of our viewers is still empty, so we first have to create a viewer. To do this, click on the New button.
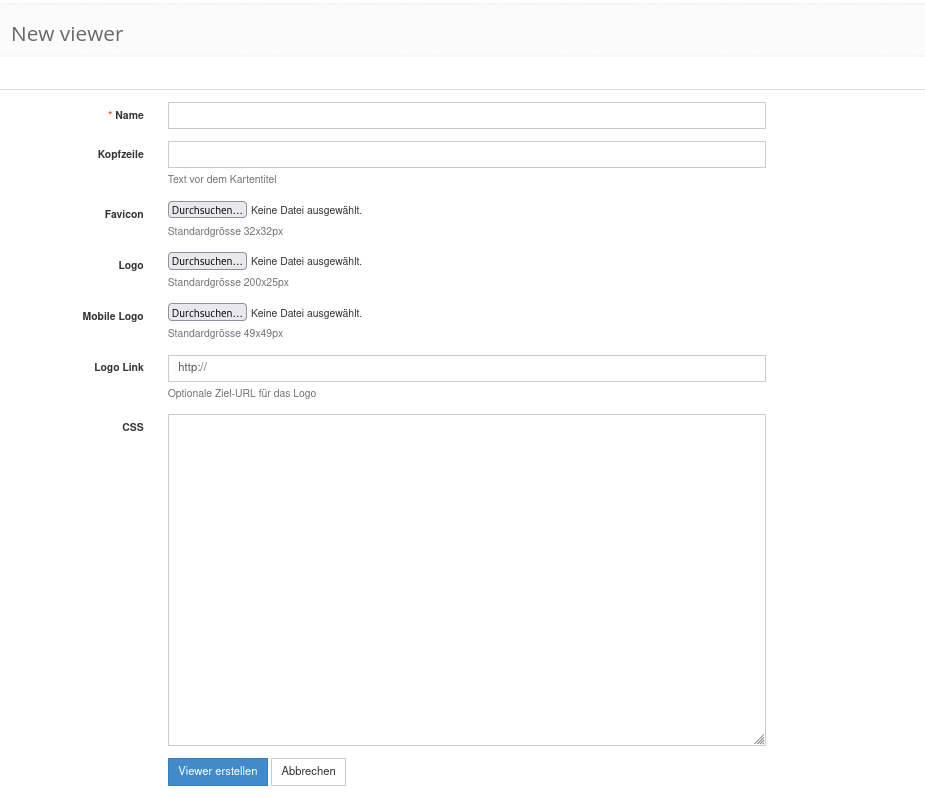
The page for managing the Viewer opens. Only a name is expected as a mandatory input. So we enter a name of our choice. It should, of course, be chosen in such a way that we can later recognize from the name what this Viewer represents. Our viewer should be called Sourcepole. We also enter a short description of the viewer in the header field. This description in the header will be used later, for example, to display the bookmarks in the browser. Now the whole thing looks like this.
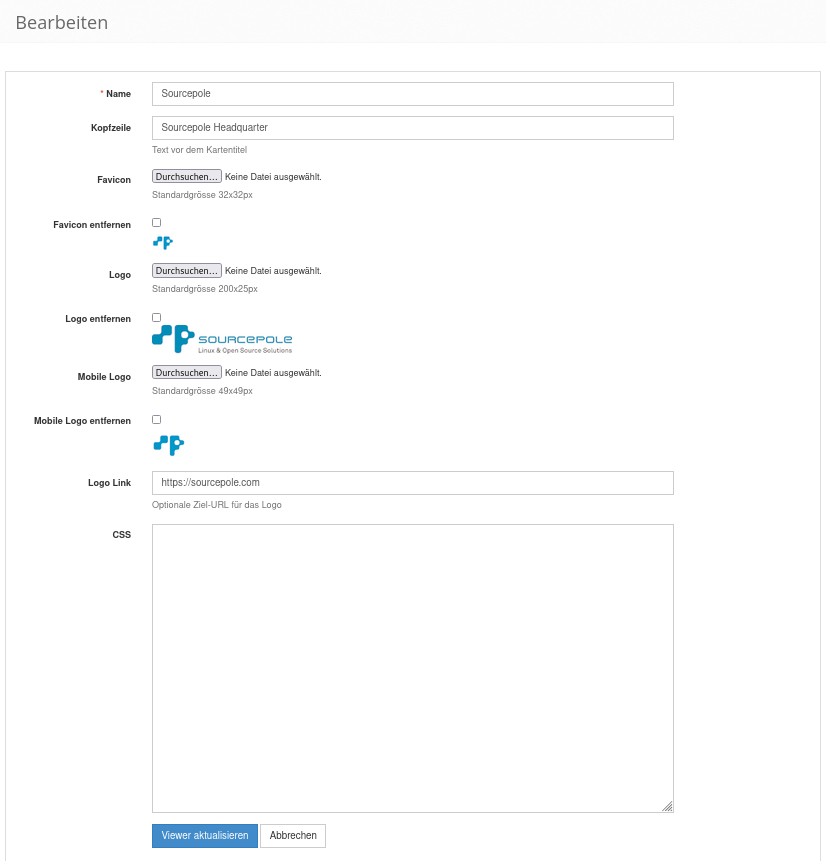
If we now click on Create viewer, our empty viewer appears in the overview. Great, that was our first goal.
Set logos
We can customize the QGIS Cloud Web Client with a Viewer. Logos are an important distinguishing feature. We can set three different types of logos.
favicon: These are the small images that appear in the address bar of the browser and in front of the bookmarks. The favicons should have the size 32x32 pixels.

logo: The desktop logo appears in the top left corner of the QGIS Cloud Web Client. If no viewer is connected to the map, we see the QGIS Cloud Pro logo there. These images should have the size 200x25 pixels.
mobile logo: In the mobile view of the QGIS CLoud Web Client the space for a logo is much smaller. Therefore we need a separate and smaller logo. These images should have a maximum size of 49x49 pixels.
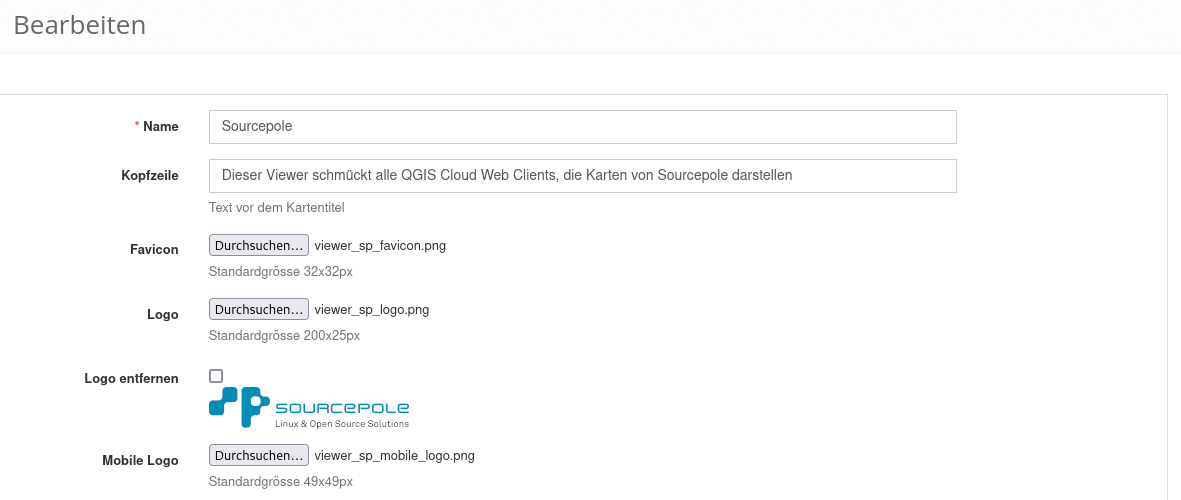
For our example here, we have prepared the three Sourcepole logos. We have opened the Viewers view again and clicked on the pencil icon next to our Viewer Sourcepole.
The viewer definition now looks like this:
It would be great if we could be redirected to the Sourcepole homepage by clicking on the Sourcepole logo. Of course this is also possible. To do this, in the Viewers view in the Logo link field, the complete target address that is to be opened when clicking on the logo must be entered.
In our case it looks like this.
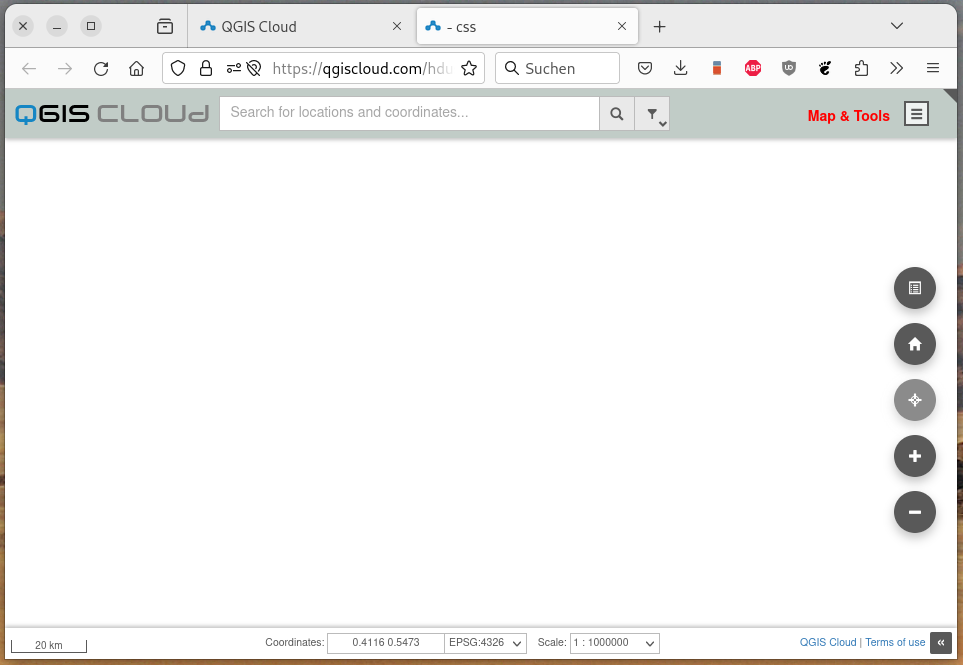
Changing the QGIS Cloud Web Client with CSS logic
The appearance of the QGIS Cloud Web Client is controlled via CSS. CSS stands for Cascading Style Sheets. It is a design and formatting language that is used to determine the appearance of HTML documents. It is therefore about design or style, not the content of a website. With CSS, users can, for example, define fonts, colors, lines, heights and widths on a website. The elements in the appearance of the QGIS Cloud Web Client are controlled via CSS. These CSS elements can be overridden by the user in a viewer. In this way, the appearance of the QGIS Cloud Web Client can be customized.
We are aware that we are already moving deep into the area of web design with this topic. We cannot write a tutorial on the use of CSS here either. There are already some good tutorials on the Internet. However, we can show you how you can basically change the CSS of the QGIS Cloud Web Client.
Here in our example, we start with an empty map so that we can concentrate entirely on the question of CSS. We don’t want to design the map, but the appearance of our personal QGIS Coud Web Client. We don’t need any map content for this. But we do need a project. Therefore, create an empty QGIS project that you then publish on QGIS Cloud. We call the project css. In the next step we need to define a viewer and connect it to the map css as described here. Let’s call the viewer MyCSS. Now we are ready to start our CSS design.
Finding CSS ID and class information
As a first change in the QGIS Cloud Web Client we want to change the color of the text of the app menu button from black to red. The text Map & Tool should therefore appear in red. But how do I start? At the beginning we are probably a little lost by the whole topic. Where do I find what, and how should I even get started? Since there are many browsers that are supported by the QGIS Cloud Web Client, but we cannot cover all of them here, we will limit ourselves to the Firefox browser. Firefox has developer tools that are very helpful when working with CSS. Other browsers also have such tools, which generally work in a very similar way.
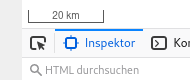
In Firefox, the developer tools are activated with the F12 key. After pressing the F12 key, Firefox looks like this:
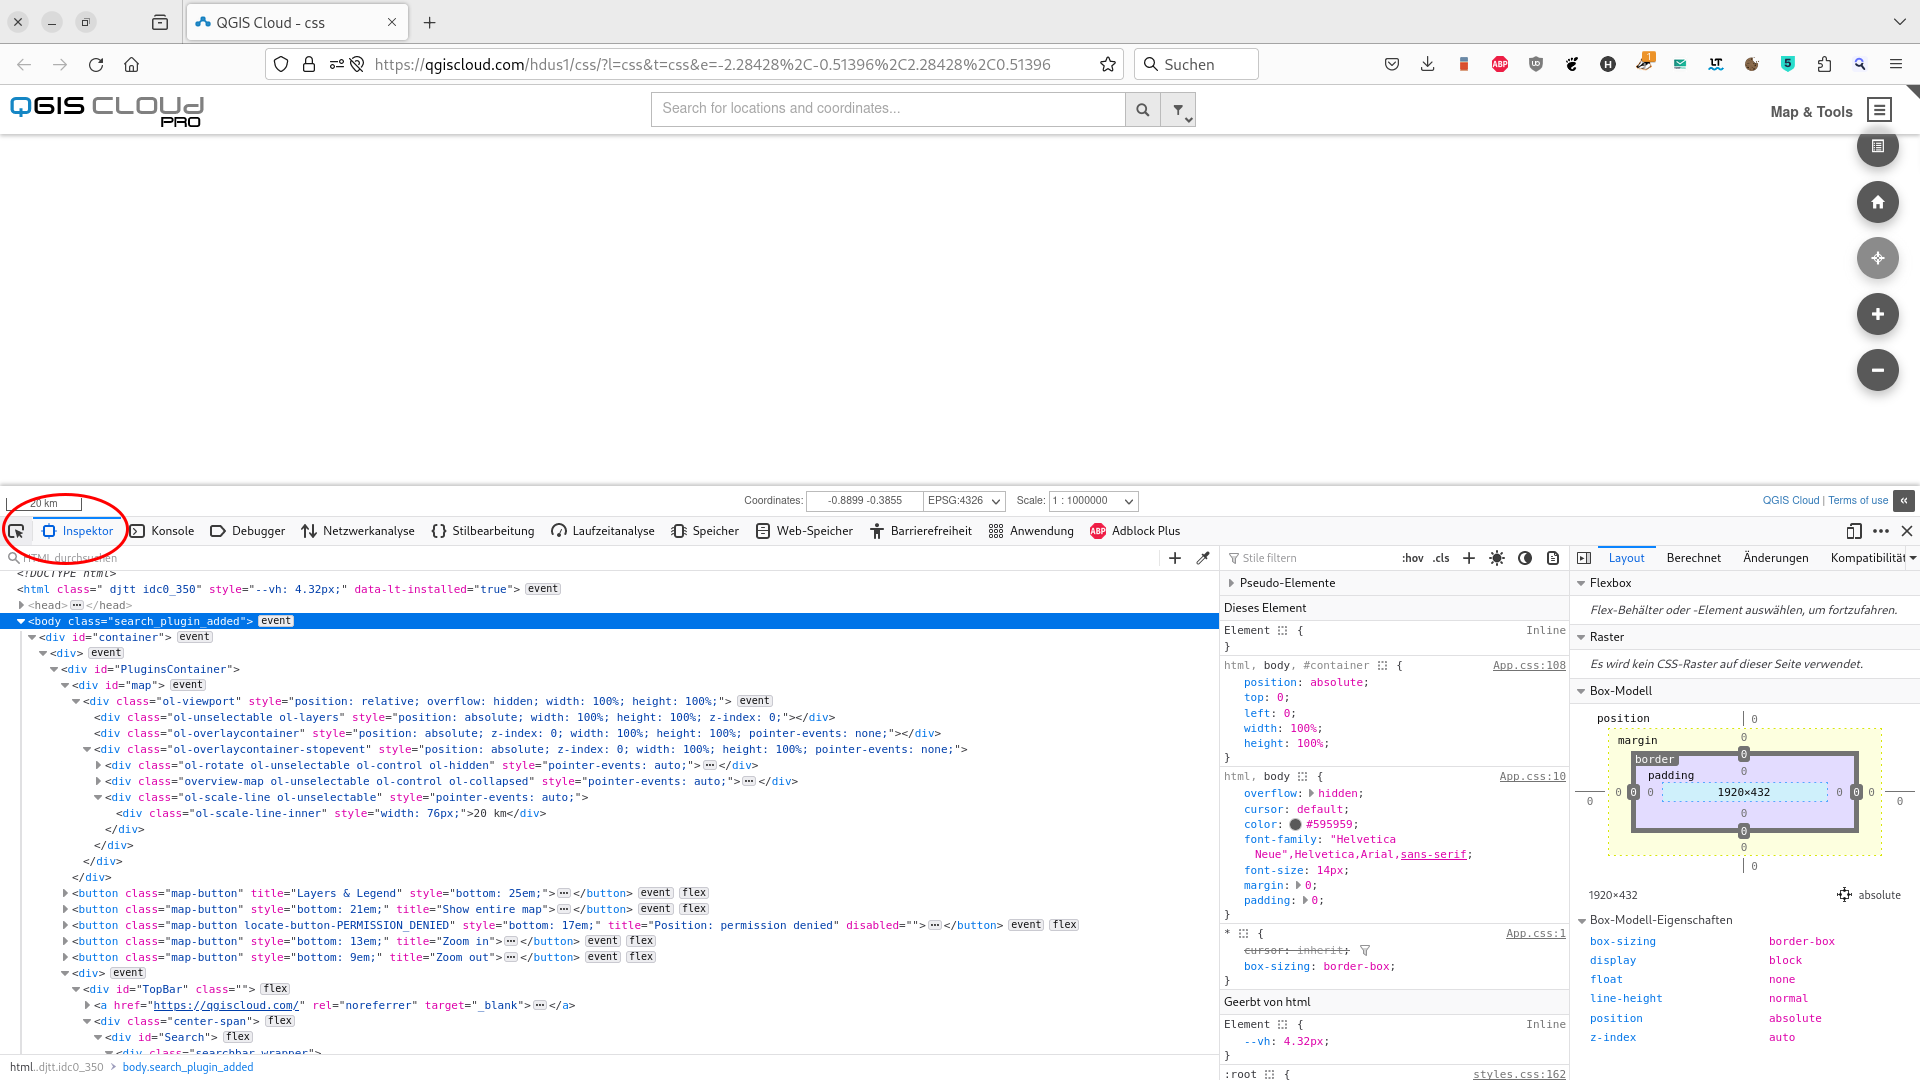
For our question we need the inspector at the top left of the developer tools.
Once we have activated it, we need to activate the selection tool.

Now we have the possibility to identify the individual elements of the page by moving the mouse pointer over the elements of the page. Whenever an element is active, the CSS information of the element is displayed. Hover over the app menu with the mouse and click on it with the left mouse button
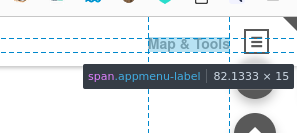
After clicking on the selected element, the cursor of the CSS inspector jumps to the exact position in the CSS where the definition of the clicked element is located.
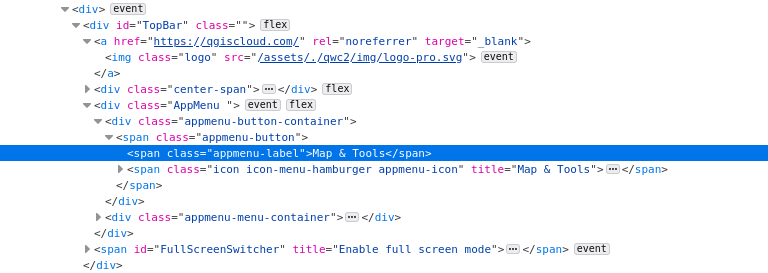
Now click on the line <span class=”appmenu-label”>Map & Tools</span>. This is exactly the line that leads us to the CSS definition of the appmenu label, whose color we want to change to red. The corresponding CSS definition for the label is now displayed in the inspector. This definition is the one we are looking for. We also learn that the CSS for the label is defined in the file TopBar.css from line 64.
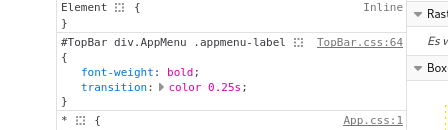
You can also click on the link TopBar.css. Then the CSS file opens directly and you can copy/paste the definition directly from this file.
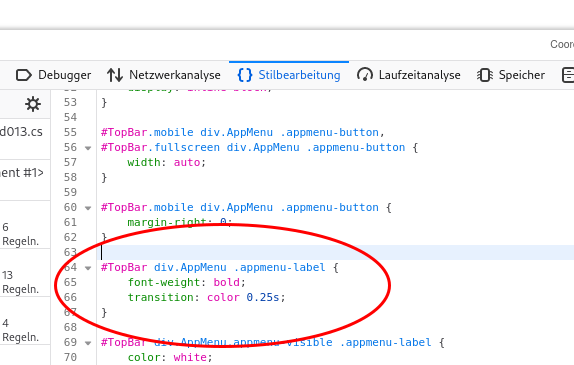
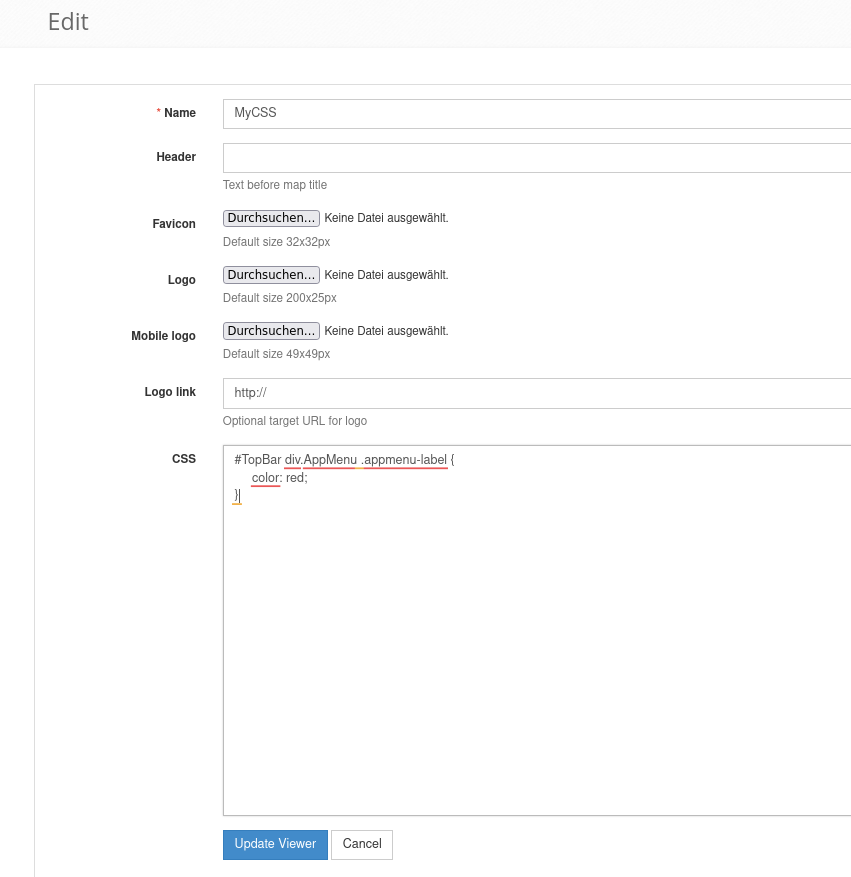
This is the entire CSS definition of the appmenu label. But how can I change the color? We can do this by color definition into our viewer and extending it accordingly. To do this, open the page on qgiscloud.com for the definition of our newly created viewer MyCSS and paste the copied CSS lines into the text field CSS. If you no longer know how, you can look here. However, this does not change the appearance of the QGIS Cloud Web Client. To make the text appear red, we still need to define the text color. We achieve this by inserting the line color: red; into the definition. As you can see, you do not have to insert the entire CSS definition again, it is sufficient if you only add your extension.
#TopBar div.AppMenu .appmenu-label {
  color: red;
}
Now you need to refresh the viewer and reload the map. You should then see the App Menu label in red.
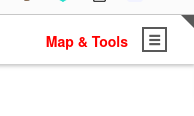
Feel free to experiment with different colors, styles and decorations. Just remember to save your viewer before you reload the page.
CSS more in detail
In the next steps, we want to customize a few components of the QGIS Cloud Web Client. First, we want to change the background color of the menu bar at the top. To do this, we first need to find out which CSS ID is responsible for this. The procedure is the same as described in the previous chapter. Press F12 to open the Developer Tools again and activate the Inspector and move the mouse over the header bar so that it looks like in the illustration.
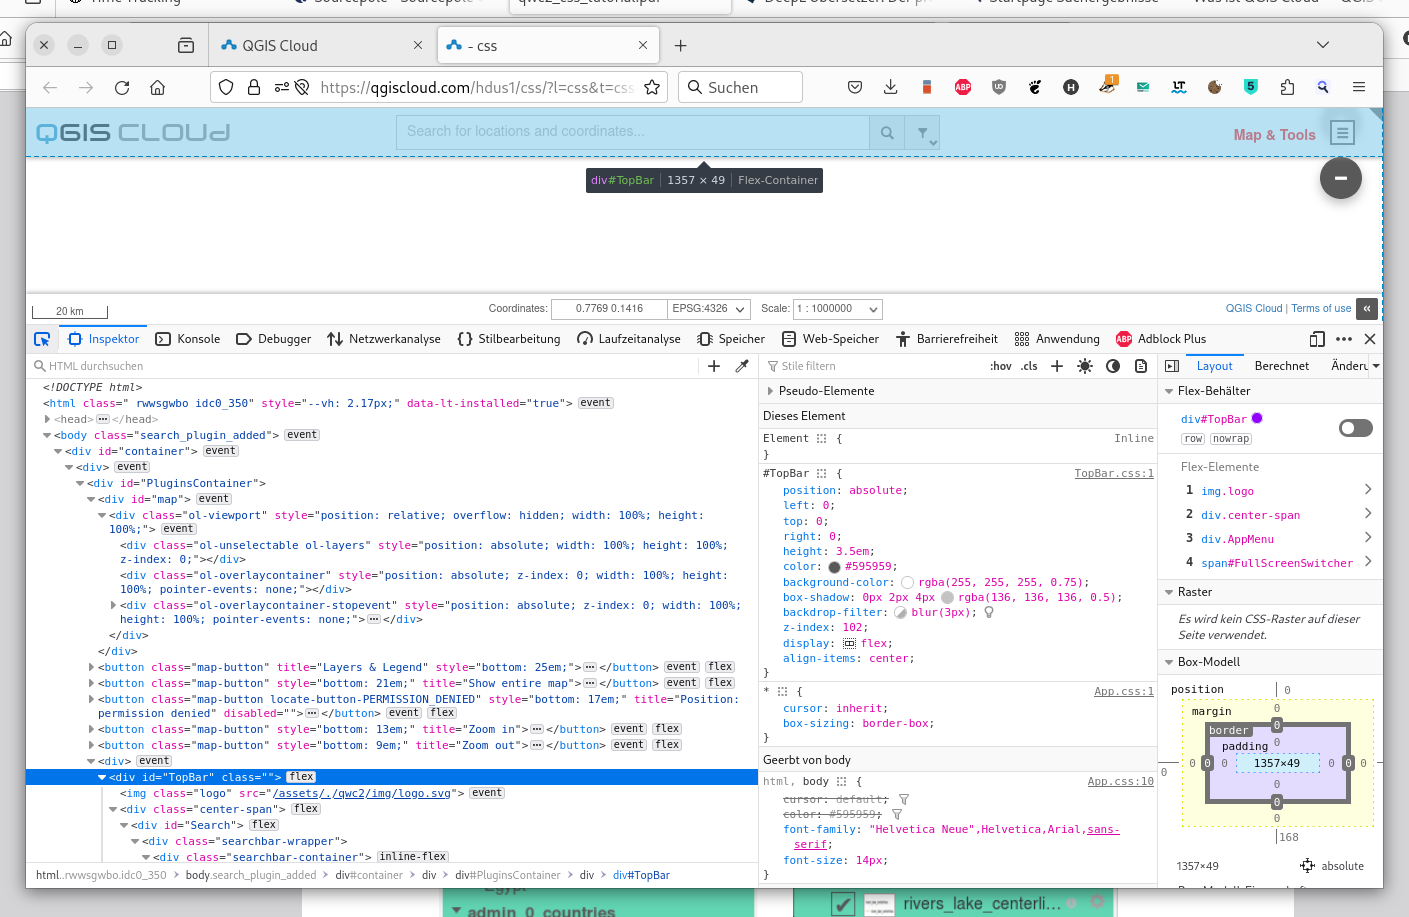
You can now see in the Inspector window that the ID of the element is TopBar, highlighted in blue. Great, now we can change the color by extending the CSS definition for the #TopBar ID with:
#TopBar div.AppMenu .appmenu-label {
  color: red;
}

#TopBar {
  background-color: #c1ccc7;
}
Don’t forget to refresh the viewer and reload the page with the QGIS Cloud Web Client. If you have done everything correctly, the TopBar element should now look like this.
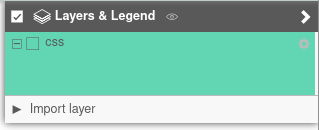
We can also change the popup menu for the layer overview. Use the Inspector to find out what the ID of the element is. Then you can start.
#LayerTree div.layertree-tree {
  background-color: #62d6b3;
}
And this is what it looks like when everything has been done correctly.
If we now add a few more design elements, the viewer can be used to design a QGIS Cloud Web Client, which then has a somewhat greener appearance.
/* Top bar and bottom bar, background color set to #c1ccc7. */
#TopBar, #BottomBar {
  background-color: #c1ccc7;
}

/* The lines of the burger menu in blue */
#TopBar div.AppMenu .appmenu-icon {
  color: #3800ff;;
}

/* The font color of the map buttons in #595959 and the background of the buttons in #c1ccc7 */
button.map-button {
  color: #595959;
  background-color: #c1ccc7;
}

/* Background color of the layer tree in #eeebeb */
#LayerTree div.layertree-tree {
  background-color: #eeebeb;
}

/* Active search element type in #62d6b3 */
#Search li.searchbar-provider-selection-active {
  background-color: #62d6b3;
}
As you can see, it is quite easy to customize the appearance of the QGIS Cloud Web Client with the appropriate tools such as the Developer Tools. Only a brief introduction can be given here. Another example of the design with CSS can be found in the Sourcepole Blog.
Map settings
In the Map Administration section, we already got a small glimpse into the possibilities of the map settings. However, with a QGIS Cloud Free account only very limited settings are possible. This is different with the QGIS Cloud Pro account.
User sefined search
As part of a QGIS Cloud Pro subscription, it is possible to implement your own – custom – search function based on a database query. This way, the search window of the QGIS Cloud web client will no longer show the information from OpenStreetmap but the information from freely defined search queries. The goal is to display a list of search terms in the search box, select an element from it and then display on the map the section around the selected element. With the selection of one of the search terms the map section jumps to this object on the map. In this way, it is very easy to extend the QGIS Cloud web client and configure it individually according to the application.
The search is defined by any SQL query, which must return two columns as a result. This is on the one hand the text that is displayed in the search box and on the other hand the spatial section belonging to the text position. Finally, the map is set to this spatial section after the search has been completed. This means that a geometry must exist for each text.
In the following section we will go into more detail about the formulation of the SQL query. We will also use examples to show how powerful this approach can be.
To exchange the database search for the standard search via OpenStreetMap for a QGIS Cloud Pro map and activate it, proceed as follows:
start QGIS
Log in to the QGIS Cloud Pro account using the QGIS Cloud plugin.
open the Maps tab.
Select the desired map and click on Map Settings.
change the Search Type to DBSearch.
select the source database from the Search DB list for the query
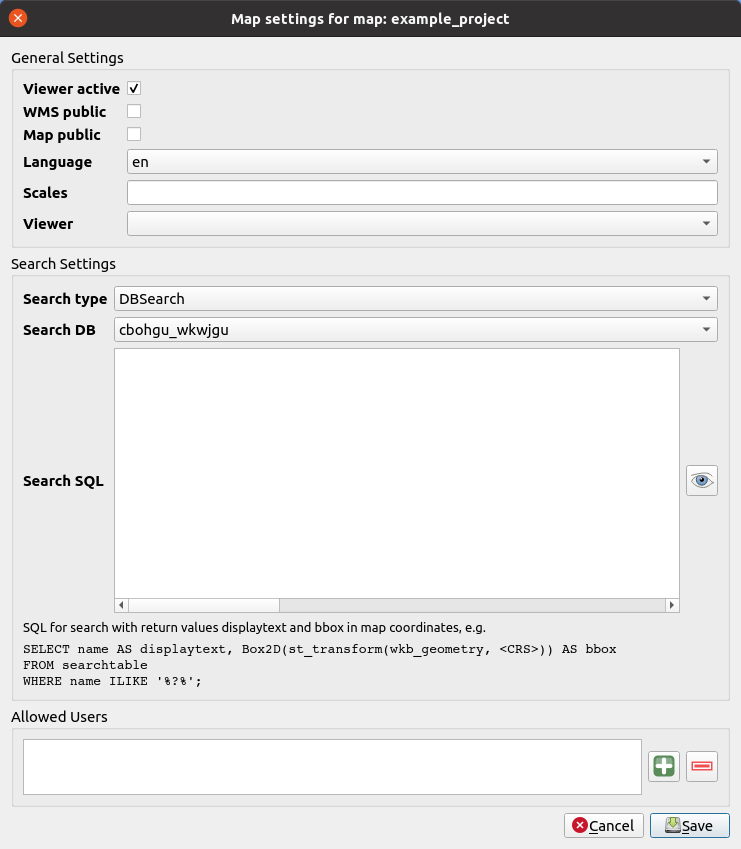
map settings customized search
Now all preparations are done to use database search.
SQL to define search
In the map settings of the QGIS Cloud plugin, the SQL query for the search can now be formulated. In our case it is defined in the map settings that all queries refer to the database cbohgu_wkwjgu.
First, we want to create a few sample tables in the cbohgu_wkwjgu database, which can be used to better explain the custom search. We can do this well with the DB management in QGIS Desktop. To do this, open the DB management in QGIS Desktop and select your QGIS Cloud database named QGISCloud xxxxxx_yyyyyy by clicking on the small triangle in front of the database name.
This makes the SQL editor available, which you can access by clicking on the icon

the sql editor
from the DB Manager.
As a first step we create the friends table in DB Manager. To do this, type the following command in the text field of the query editor.
CREATE TABLE friends (
id SERIAL,
name VARCHAR,
geom GEOMETRY (Point,4326) );
Then execute this query by clicking the execute button. If you did everything correctly and did not include any error in the query, then next to the execute button it should say: 0 rows, 0.xxx seconds
Now we need to populate the friends table with values.
INSERT INTO friends (name, geom) VALUES
('Paul', st_setsrid('POINT(-0.86 52.12)'::geometry, 4326));
INSERT INTO friends (name, geom) VALUES
('Steve', st_setsrid('POINT(13.46 52.50)'::geometry, 4326));
INSERT INTO friends (name, geom) VALUES
('Mary', st_setsrid('POINT(8.33 46.95)'::geometry, 4326));
INSERT INTO friends (name, geom) VALUES
('Tim', st_setsrid('POINT(2.38 47.78)'::geometry, 4326));
Now we have everything ready to implement our custom search. The definition of the search is again done in QGIS Cloud Plugin. Open the plugin and switch to the Maps tab. Open the map settings as you learned in section Pro Map Settings]. The core of the search is an SQL query written to the Search SQL text field. It must follow a certain pattern and look like this
SELECT name AS displaytext, Box2D(wkb_geometry) AS bbox
FROM <table>
WHERE name ILIKE '%?%';
Where means:
name – is a column containing some strings. The contents of the name column are displayed in the search field.
wkb_geometry – a column containing geometries.
tablename – is the name of the table (aka layer) to search.
%?% – is the placeholder for the search string.
If special characters or capital letters are to be used for column names or table names, they must be quoted with “” – double quotes!
We want to implement a search for our friends. We want the search to be such that when an initial letter is entered in the search box, all friends with that initial letter in their name are listed. The list shall be narrowed down more and more as more letters are entered.
The first part of a SQL query is always the SELECT. We need a text, in our case the names of our friends. So we can start the SQL query like this:
SELECT name AS displaytext
As you can see we have given the name column the alias displaytext. This must be the case and cannot be changed.
We also need a section to which the map should be pushed. Since the location of our friends is known – as a point – we still need to query the section around the respective point. To do this, we determine the bounding box around the respective points that are stored in the column geom:
SELECT name AS displaytext, Box2D(geom) AS bbox
The BoundingBox is also given the alias bbox. As with the displaytext, this must be mandatory.
In the next step, we need to define the table to be queried.
SELECT name AS displaytext, Box2D(wkb_geometry) AS bbox
FROM friends
Now our query is about to finish. Try out what happens if you define the query like this. Does the result correspond to our task?
Something is still missing, namely the selection by letters, starting with the first letter. So we still have to define a condition. Since we want to filter only over the names we must formulate the filter as follows:
SELECT name AS displaytext, Box2D(geom) AS bbox
FROM friends
WHERE name ILIKE '?%';
Try the search. If you did everything right, the search will behave exactly as we defined it at the beginning. You can formulate any complex queries for the search. The only condition is that the query results in a list with two columns named displaytext and bbox.
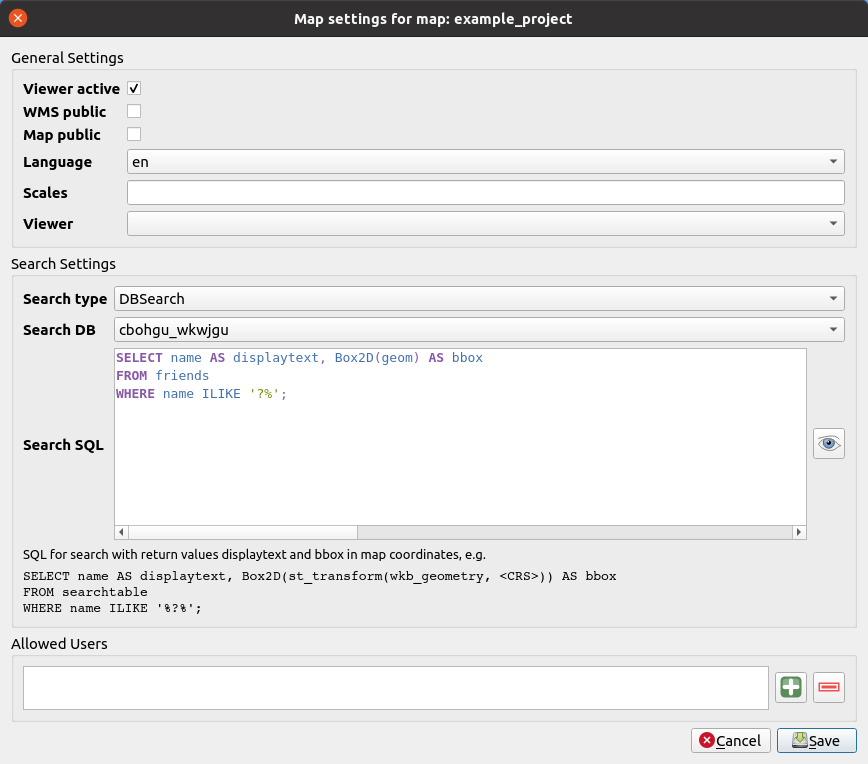
map settings with search
CAUTION Note that the CRS of the result column bbox must be the same as that of the project. In our example data, the points have a the CRS 4326 – that is, WGS84. If the published project is referenced in a different CRS, then the QGIS Cloud Web Client would move the map to the point’s bounding box in WGS84 Coordinates. But this is not true and the wrong section would be selected on the map. That’s why in this case you need to do a transformation of the points’ coordinates to the map’s CRS. Fortunately, PostGIS offers the appropriate function for this. The transformation can then be done as follows.
... Box2D(st_transform(<geometry column>, <CRS>)) AS bbox
Replace the (<CRS>) with the CRS of the published map.
You can make your life much easier by defining a search view in the selected DB, which you can manage with PgAdmin or QGIS DB Manager:
CREATE or REPLACE VIEW myserach as
SELECT name AS displaytext, Box2D(geom) AS bbox
FROM friends
WHERE name ILIKE '?%';
Then they use this view for the search query field instead of a very complex SQL query:
SELECT displaytext, bbox FROM mysearch WHERE name ILIKE '?%';
If you want to change the search query, you can do it very comfortably with PgAdmin or QGIS DB Manager. If you use this option, you do not need to change the search query in QGIS Cloud Backend.
Access protection of maps
Maps and services published under a QGIS Cloud Free account are generally public. They are published to www.qgiscloud.com immediately after publication and can be seen and used by anyone in the world. After a while, the small maps disappear from www.qgiscloud.com. But those who have the URL to the map can still access it at any time. Unlike the maps, the data in the QGIS cloud database is always accessible only with proper authentication. They are personally linked to the QGIS Cloud account. Access to the data is entirely under your control!
With QGIS Cloud Pro there is the possibility to restrict access to maps and services for a certain group of users and thus control access These users must then first log in with their QGIS Cloud username and password before they can access the protected map. In doing so, only the administrator of the map needs an QGIS Cloud Pro account. The other users to whom the map is to be shared must have at least an QGIS Cloud Free account registered with QGIS Cloud.
Sharing the map with a specific set of users can be done in the QGIS Cloud plugin under map settings. In our example, the map and WMS services example_project will be shared with the QGIS Cloud user user1. By entering new user names and clicking add user, the map can be shared with any number of additional users.
share a map in QGIS Cloud Plugin
Under a QGIS Cloud Pro, newly published maps and web services are always access protected. If Pro maps are to be accessible without access protection, the QGIS Cloud plugin’s map properties can be set to map public or WMS public. WMS public can be checked.
Import external data into the local web map
Data from external web services: WMS, WMTS, WFS
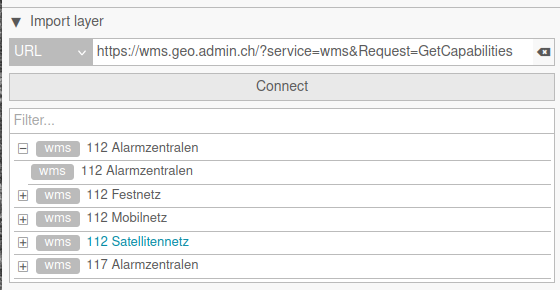
With QGIS Cloud Pro you can also load external WMS WFS or WMTS layers into the map. Under Layers & Legend you will find the option “Import Layer”. Enter the URL of the desired service there in the form:
Make sure that you connect to the web service via https, as the QGIS Cloud Web Client only communicates via https. If you now click on Connect, all levels offered by the service will appear. offers. After selecting a layer, it is added to the map. To make this setting persistent for this map, you must save the page as a bookmark in your browser. Whenever you open this bookmark, the map will be reloaded with exactly this setting.
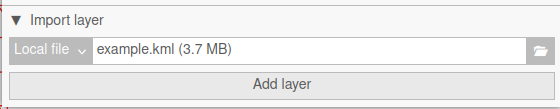
File-based local data: KML, JSON, GeoJSON
Just as with web services, you proceed with local file-based levels. However, in this case, you cannot make the file-based local data persistent via a bookmark.
Edit geodata
Geospatial data from QGIS Cloud can be included in QGIS Desktop as a PostGIS- layer or as a WFS–T- layer (see section WFS-T) and edited using QGIS’s editing tools (section Access to QGIS Cloud Database).
However, editing of geodata is also possible in the web map in the internet browser. A local installation of QGIS–Desktop is then no longer necessary. Since with an editable web map all users with access to the map can also edit, it is recommended to make editable maps only accessible to specific users (section Access Protection of Maps).
To make it possible to try out the editing functionality without a pro account, there is a test map https://qgiscloud.com/mhugent/sandbox_map. On this sandbox map, new objects can be added or existing ones changed at will.
A prerequisite for editing a layer is the correct geometry type of the layer. geometry type of the layer. At the moment only 2-dimensional vector data can be edited. can be edited. This means that the following geometries are not supported supported:
PointZ, PointM
LinestringZ, LinestringM
PolygonZ, PolygonM
Prepare editable layers
Editing a layer means creating new geometries or the attributes or editing existing ones. Basically, each data table loaded into the QGIS Cloud DB via the QGIS Cloud Plugin has the column qc_id, which generates automatic values. This column must not be editable within the edit function, as it should contain unique, automatically generated values. If a value were to be entered manually in this field, there is a risk that this value would then appear twice in the table, and this is not permitted and would lead to an error when saving the entry. To prevent editing the column qc_id we have to hide the field in the edit mask in QGIS Cloud Web Client.
Open the layer properties dialog of the corresponding layer and select the Attribute Form option. Now you will see all fields of the layer listed. At the very top you should see the qc_id field. Please click on qc_id.
If you now set the Widget Type to Hidden as shown in the figure, this field will no longer be displayed when you enter it in the edit mode in QGIS Cloud Web Client. When you save the changes, the next free unique value will then be generated automatically.
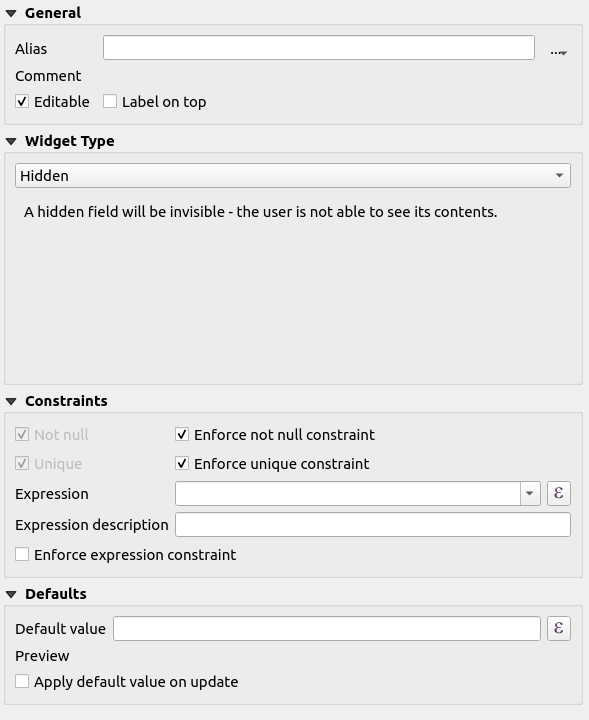
qc_id verstecken
This way you can hide all the fields you don’t want to see in the QGIS Cloud Web Client edition.
To try out the edit functionality we want to make the flow layer in the example map from section Example Map editable. To do this, we check the appropriate layer in the map properties on the QGIS Cloud website under editable layers and click update map at the bottom of the page. The Editable Layers entry is only visible in QGIS Cloud Pro in the Map Properties.
set editable layers
In the web map there is now an entry Edit under Map & Tools -> Tools. After pressing on it, you can select the layer to be edited. With Select you can edit an existing object, with Draw you can create a new object on the map.
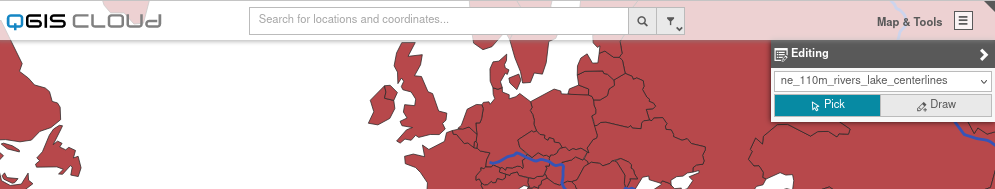
the edit tool in QGIS Cloud Webclient
QGIS Cloud takes into account the data types and edit settings in the published QGIS project:
Attributes that have the edit type Hidden in QGIS will also not be displayed when editing in the web map.
Attributes with type bool are displayed as on/off sliders.
Attributes with type date or timestamp are displayed in a calendar view.
Integer attributes are displayed in a spinbox. The minimum/maximum value constraints and step size selected in QGIS are applied.
Attributes with edit type value mapping are displayed in a combo box when editing in the web map
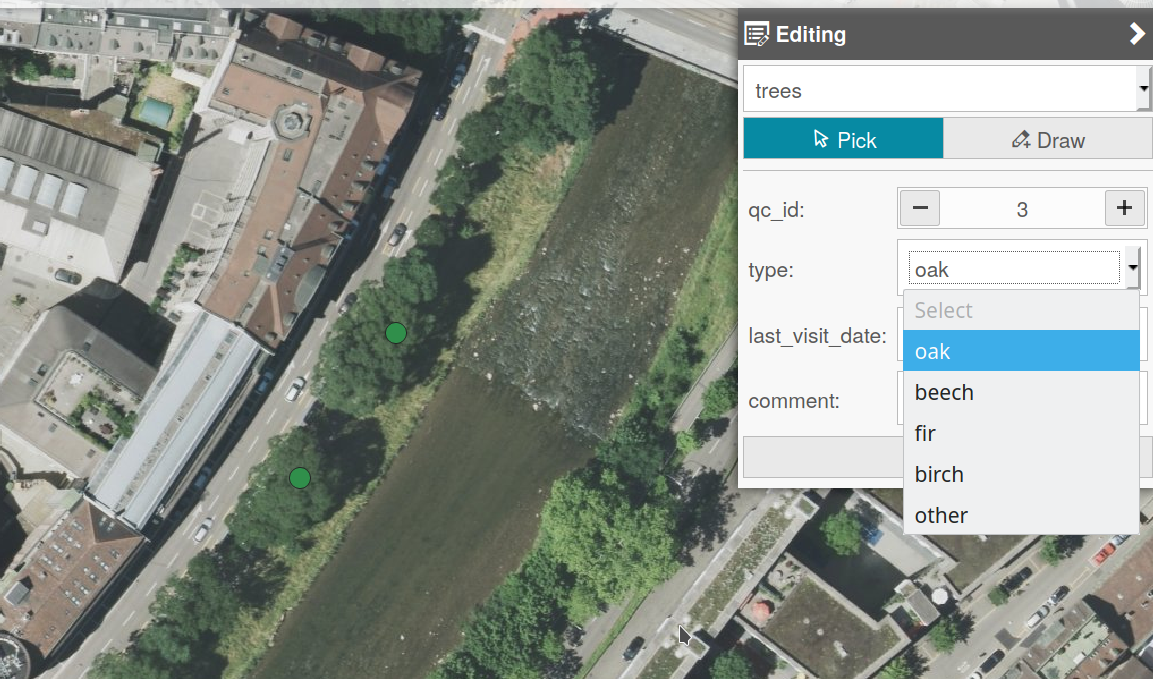
a combobox in attribute editing
So let’s go ahead and digitize the line. For this purpose, the vertex points of the line are set with a mouse click. If you want to finish digitizing the lines, double-click to end the process and open the attribute form for entering the attribute information.
The vertex points of the line can also be edited:
move - move the mouse cursor over the vertex point. When the point turns blue, it can be grabbed and moved with the mouse
add - double-click on the line and a vertex point will be added
delete - with shift + click a point is deleted again